
Soil Field Log (beta)
The Soil Field Log is the new way to record soil test holes in landplan.io. You log a hole the way you dig it, from the surface down, on a phone in the field or at a desk. It saves to the same soil tests as the existing soil tools, so everything you enter shows up in the soil test list, the designs and the reports.
Beta
The Field Log is a prototype while we test it with evaluators. The existing soil tools stay available and work on the same soil tests, so you can switch between them at any time. Tell us what works and what doesn't with Send feedback in the Field Log header.
Open the Field Log
- On the map: click Tools, open the Soil group and click Field Log (marked Beta). Click it again to close the Field Log.
- From the soil test list: in the ⋮ menu (More soil test tools), choose Try the new Soil Field Log (beta), or click Open in Field Log (beta) on a soil test's row.
On a computer the Field Log is a panel on the right of the map, so you can still pan, measure and check setbacks while you log. On a phone it opens as a sheet over the map: drag it up to log a hole, and down to see the map. The Field Log and the soil test list share the space: opening one closes the other.
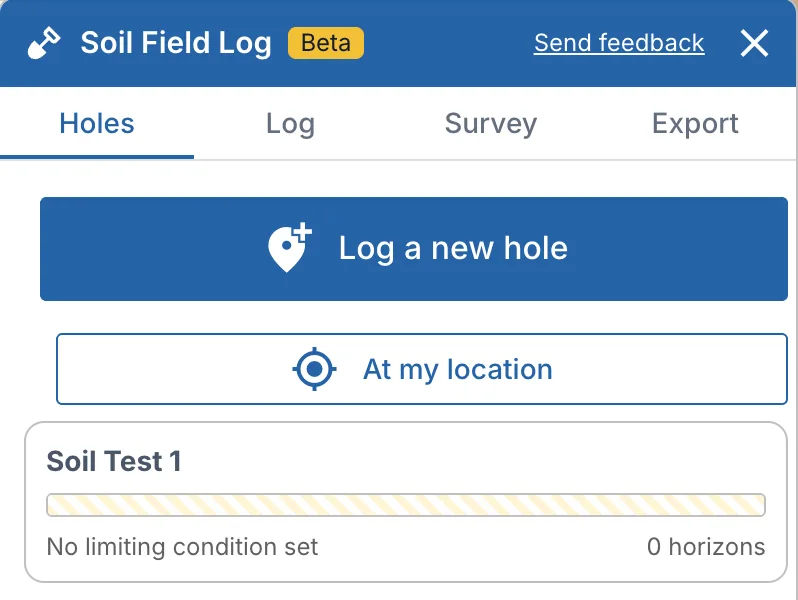
The Field Log has four tabs:
| Tab | What it's for |
|---|---|
| Holes | Every test hole in the project, each with a small profile bar, its most limiting depth and any depth problems |
| Log | One hole: the site, the horizons, the limiting conditions, percolation, and Save |
| Survey | The USDA soil survey (SSURGO) at the hole: map unit, drainage, the septic absorption rating and the survey's horizons |
| Export | Download the holes as CSV or GeoJSON, or open the state soil form |
Each hole on the Holes tab shows its most limiting condition (or No limiting condition set) and how many horizons it has. Click one to open it on the Log tab.
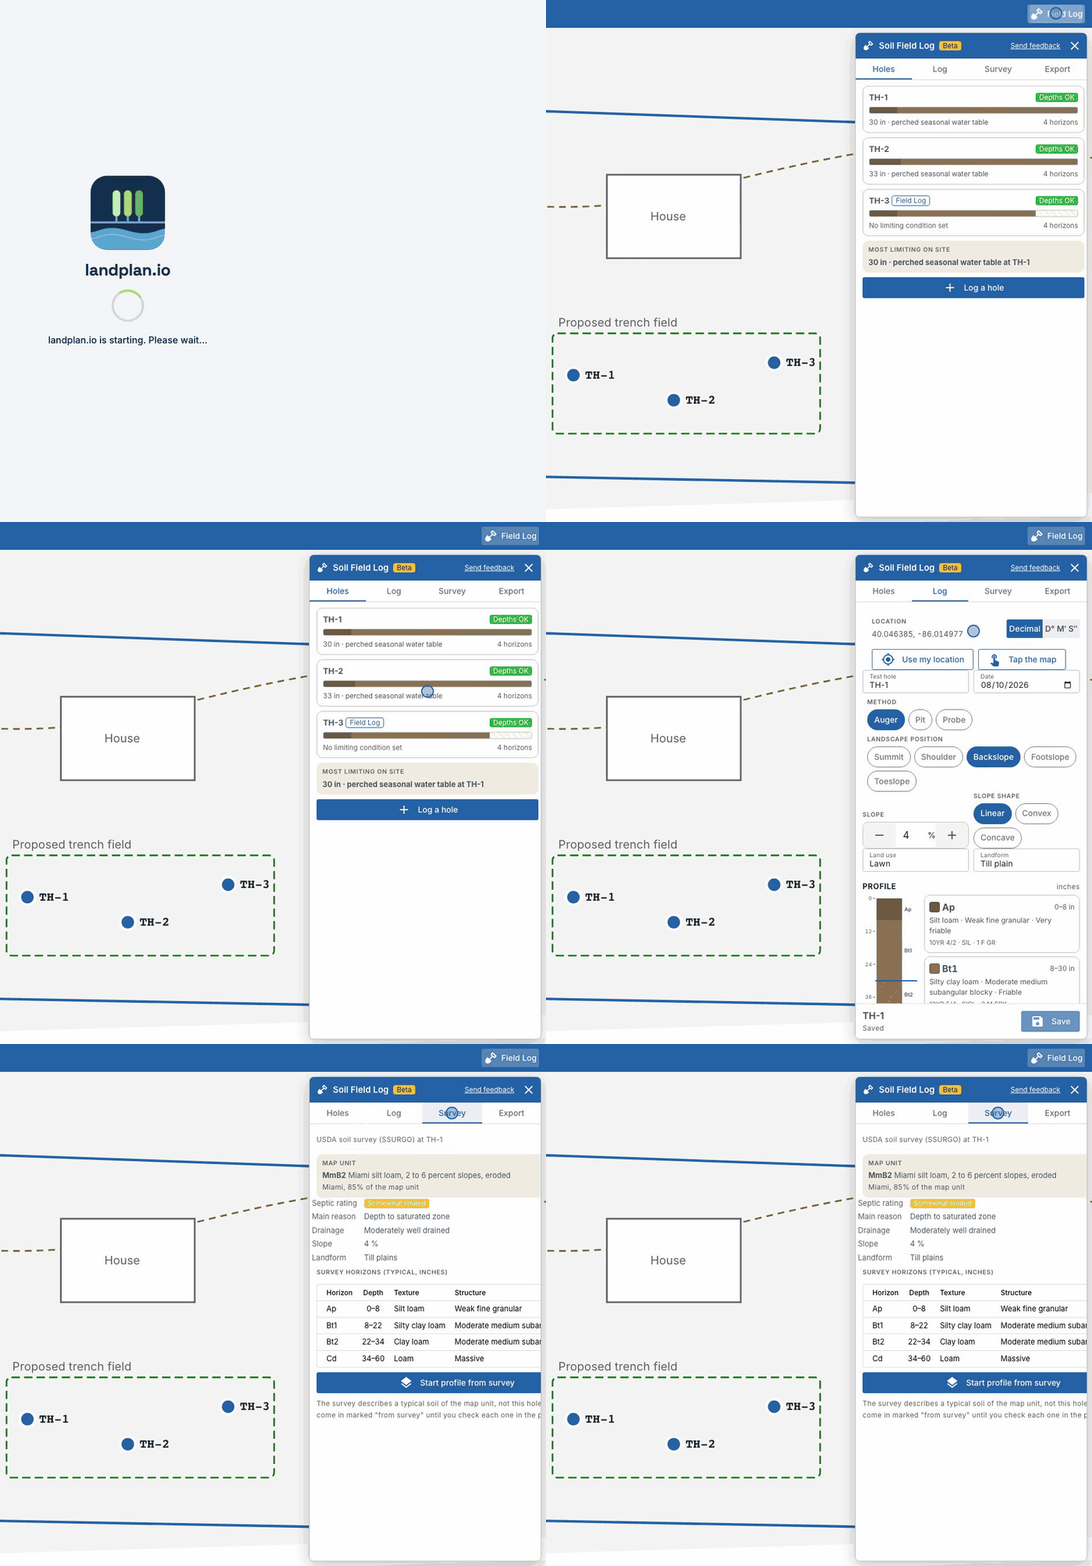
Log a test hole
- Place the hole. On the Holes tab, choose Log a new hole and tap the map where you dig. To use your GPS position instead, choose At my location (or Use my location in the "Tap the map" banner). The app shows how accurate the GPS position is. You can move the hole later with Move: map or Move: GPS.
- Check the profile. Where the soil survey is available to you, the profile already holds the soil survey's horizons at that point (see Start from soil data). Otherwise it starts with one empty horizon.
- Add or change a horizon. Tap a horizon in the list or in the profile column to open it. Add horizon at … in adds the next one where the last one ends, so depths can't leave gaps or overlap; a Thickness button (4, 6, 8, 12, 18 in) sets its bottom in one tap. To move the boundary between two horizons, drag it on the profile column (or select it and use the arrow keys).
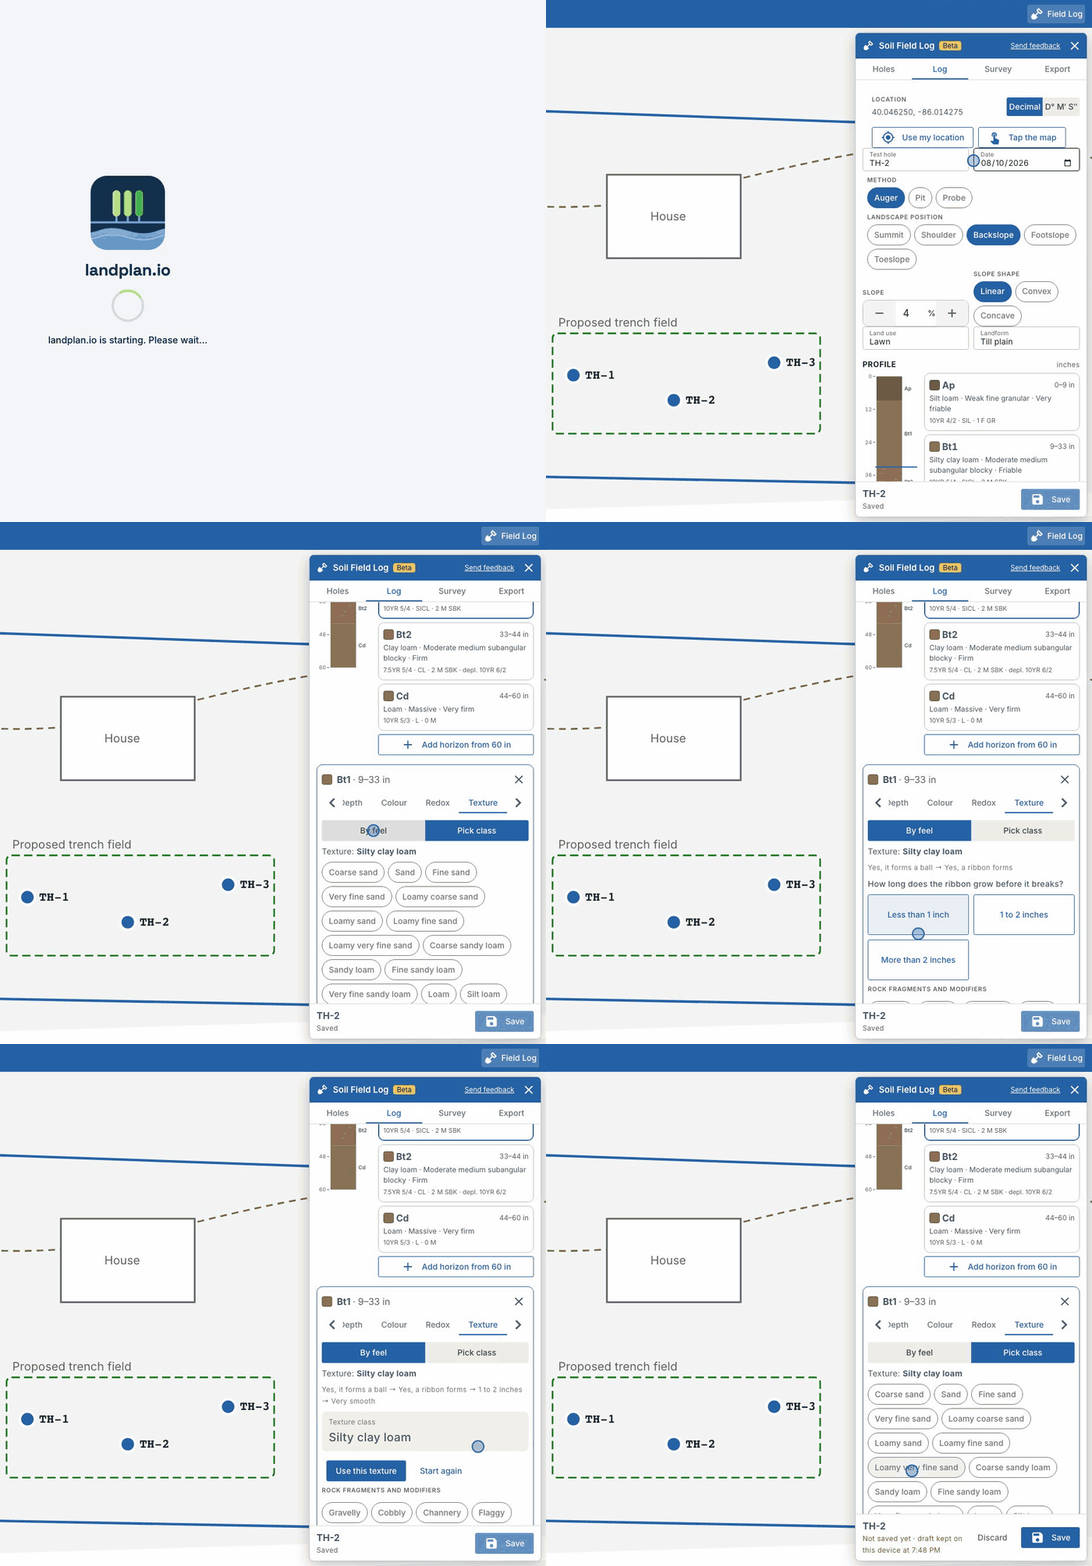
- Describe the horizon. It all fits on one screen. Each part closes to a one-line summary once it's filled:
- Name and depth: the designation (for example Ap, Bt1, Cd), the top and the bottom.
- Texture: answer the Find it by feel questions (ball, ribbon, grit), or pick the class. The textures you used last are offered first.
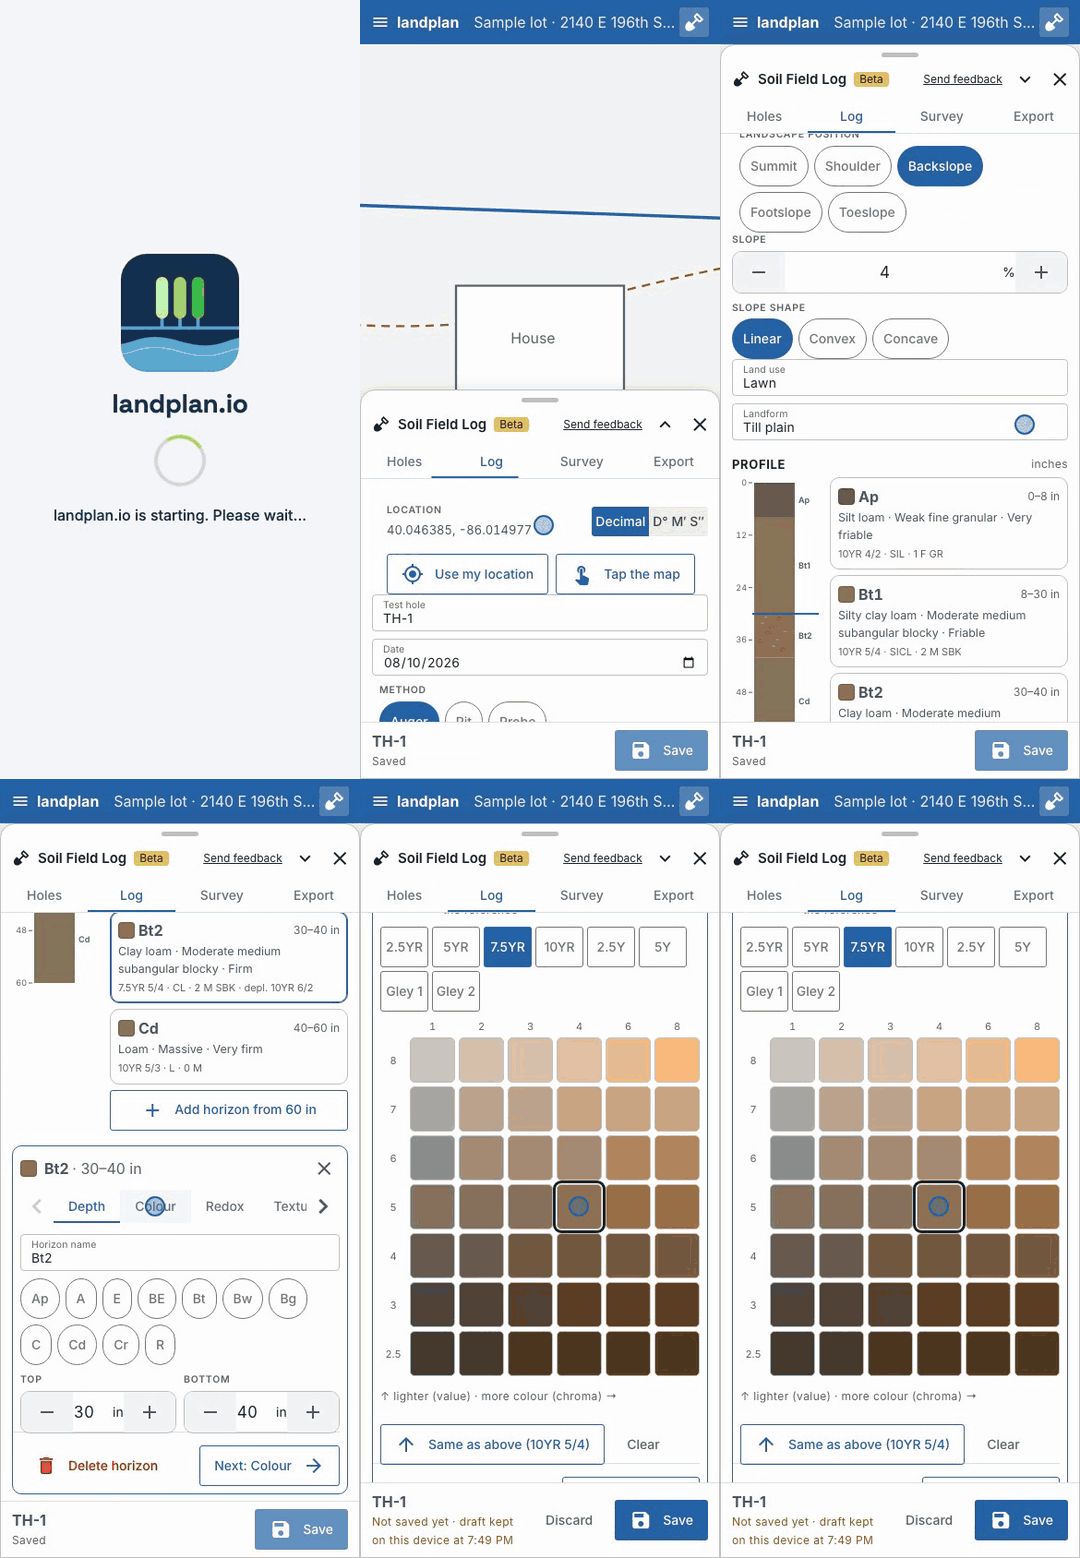
- Colour (moist): pick the hue page, then the value and chroma chip, exactly as on your Munsell card, or one of the colours you used last, or Same as above. The Field Log saves the notation (for example 10YR 5/4).
- Structure: shape, how distinct it is (grade) and size, in words. The app saves the standard codes.
- Rust and gray spots (redox features): concentrations and depletions, each with a colour and an amount.
- Firmness (moist consistence), Rock fragments and clay, and Notes (roots, boundaries, odor, refusal).
- Split or merge. Split cuts a horizon in two at its middle (Bt becomes Bt1 and Bt2), and Merge below joins it with the horizon underneath. Delete removes it.
The profile column on the left draws the hole to scale in its colours, and marks anything not yet logged.
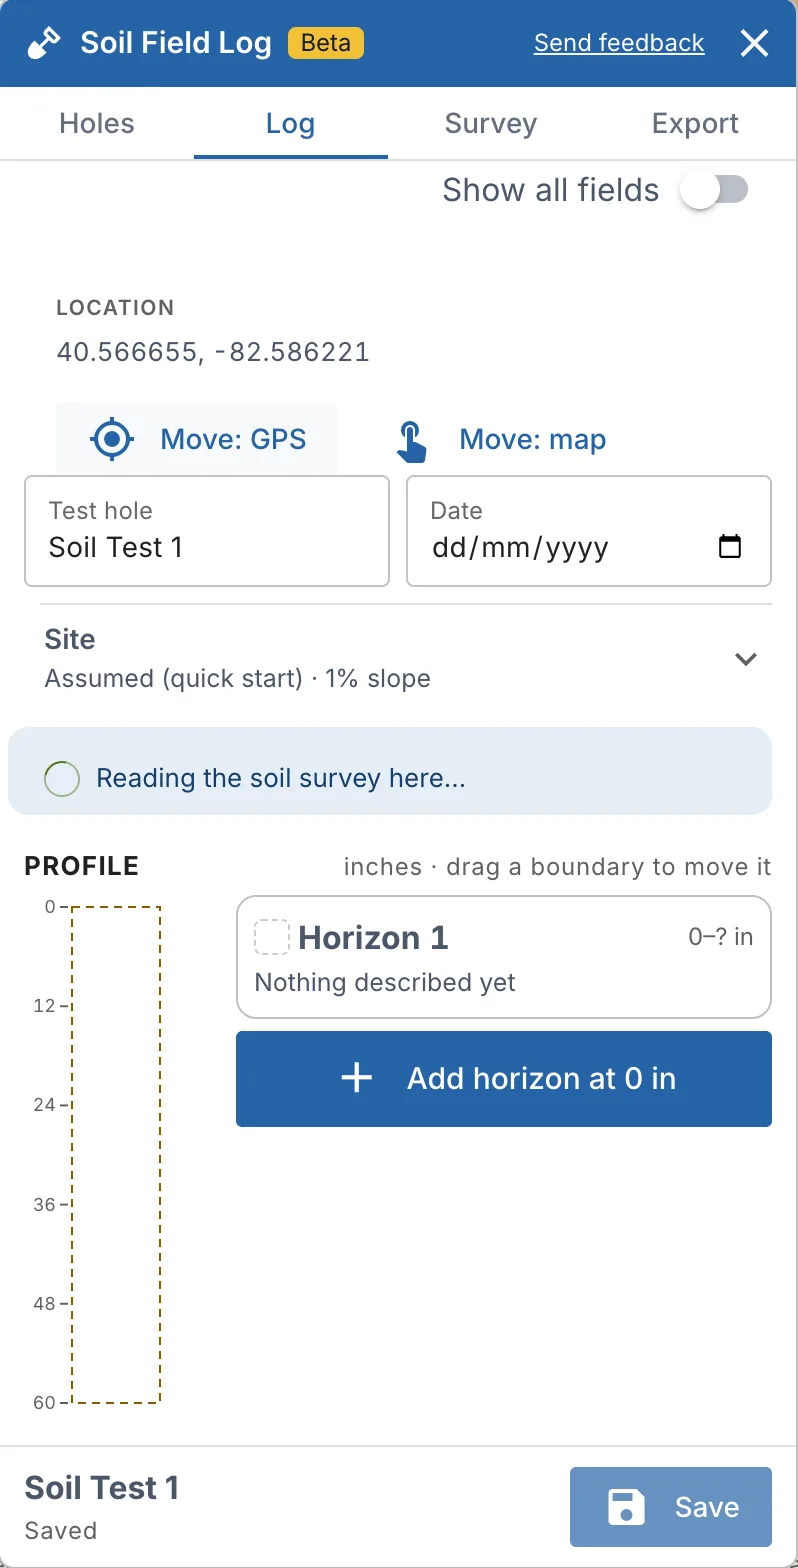
Above the profile are the hole's Location (move it with Move: GPS or Move: map), its Test hole name and Date, and the Site: the slope and site details, Assumed (quick start) until you set them.
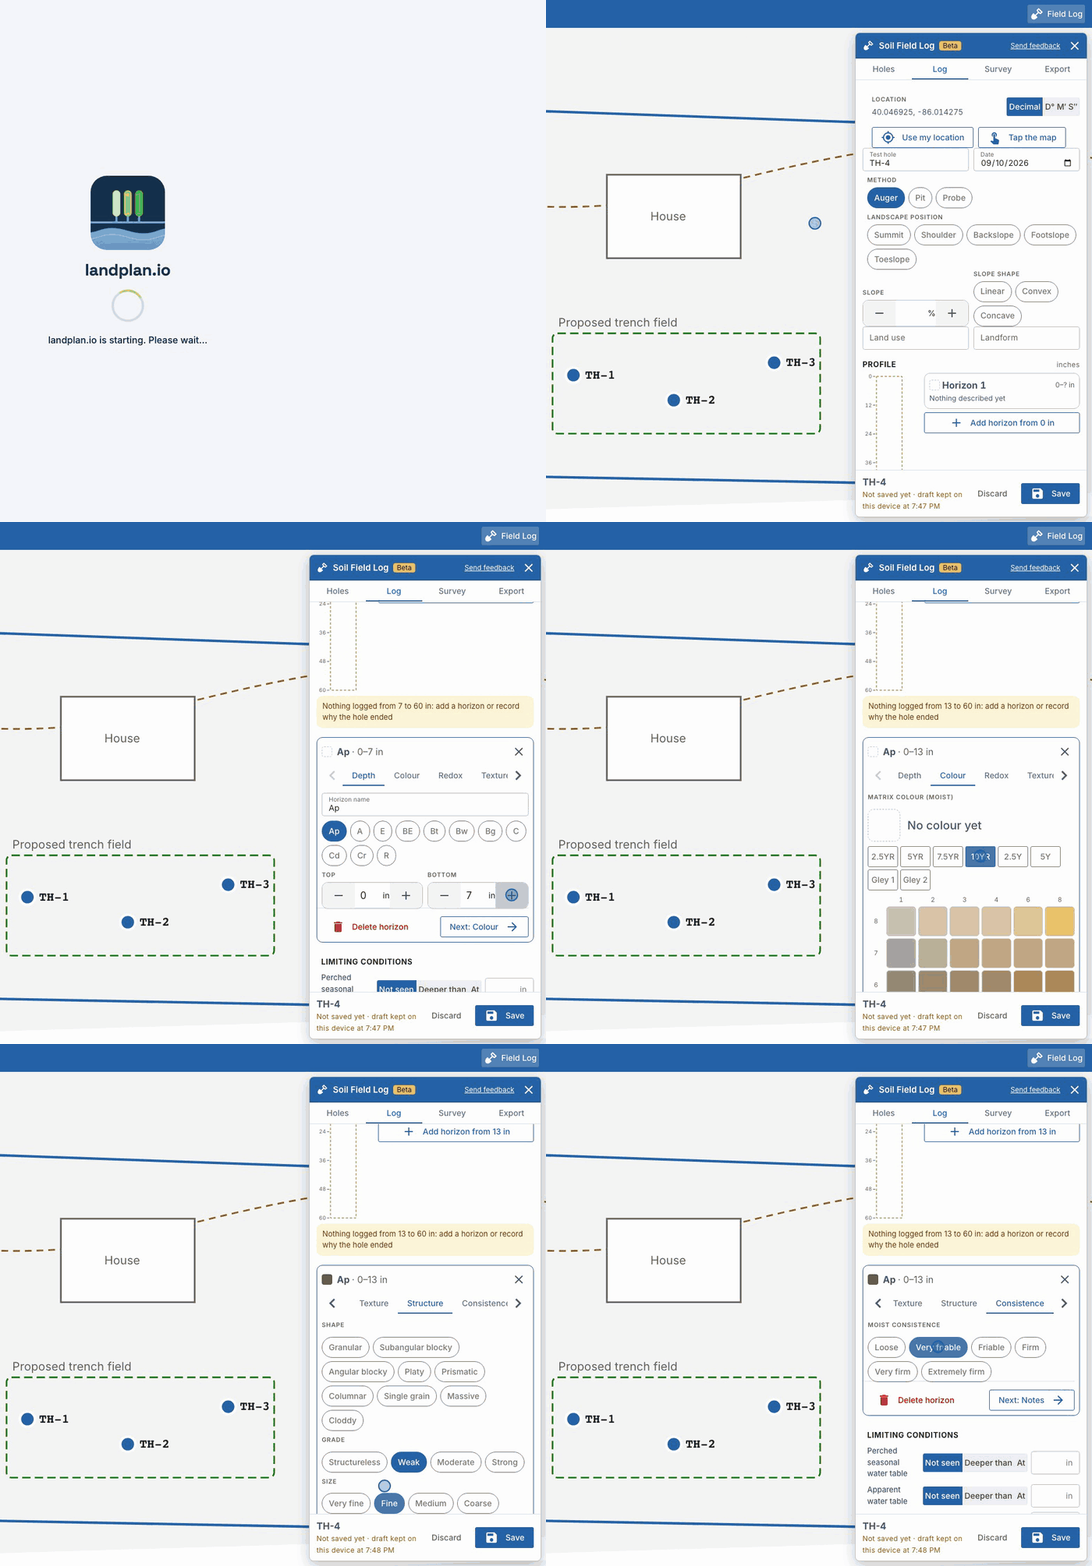
Show all fields
Turn on Show all fields at the top of the Log tab to see every field at once: each part of each horizon opens, the soil science terms and the codes the records use are shown (for example "Subangular blocky SBK"), along with the fragment description, quick note phrases for roots and boundaries, the site details and each horizon's loading rates. The Field Log remembers your choice on this device.
Start from soil data
Where your landplan.io account has the soil insights (the same NRCS soil survey data as the Soil insights card in Smart design), a new hole starts from the soil survey at its point:
- the horizons of the main soil there, with their depths, USDA texture and clay, and their structure when the survey has it,
- each horizon's permeability (from the survey's saturated hydraulic conductivity), as a hint,
- a short card, Soil survey here, with the main soil and what to look for: a possible seasonal high water table and a possible limiting layer with their depths, slow permeability, drainage, a possible wetland, flooding or ponding, the survey slope and the NRCS septic rating.
The survey never gives a soil colour, redox features or consistence, so those are left for you. Every value from the survey is marked Survey (From the soil survey — check in the field) until you change it or confirm the horizon with Looks right. If you save with values still marked, the Field Log asks first: Check them takes you back to them, Save as they are keeps them. The survey's water table and limiting layer are only suggested under the limiting conditions; nothing is set until you accept it.
Not what you see in the hole? Choose Start blank instead. For a hole with nothing logged yet, Start from soil data fills it. Without the soil insights, or where the survey has no soil, the Field Log works as it always did.
Check the limiting conditions and save
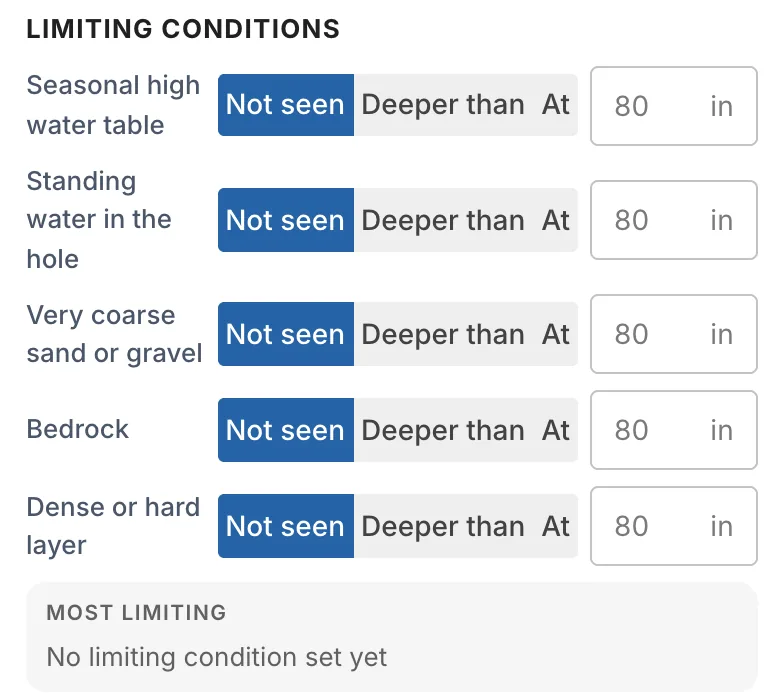
Below the profile, Limiting conditions has a row for each one, in plain words:
| Row | The condition |
|---|---|
| Seasonal high water table | Perched seasonal water table |
| Standing water in the hole | Apparent water table |
| Very coarse sand or gravel | Permeable material |
| Bedrock | Bedrock |
| Dense or hard layer | Restrictive layer |
On each row, choose Not seen, Deeper than or At, and type the depth in inches for the last two. Not seen is the forms' N/A: the condition wasn't observed, and the report reads None observed when no condition is set.
The Field Log also suggests limiting conditions from what you logged:
- a seasonal water table at the first subsurface horizon with gray (low-chroma) depletions or a gray matrix,
- a restrictive layer at a fragipan, dense or cemented horizon, or massive, very firm material,
- bedrock at an R or Cr horizon.
With soil data at the hole, the survey's seasonal high water table and limiting layer are suggested too, marked Survey, where the profile itself suggests nothing.
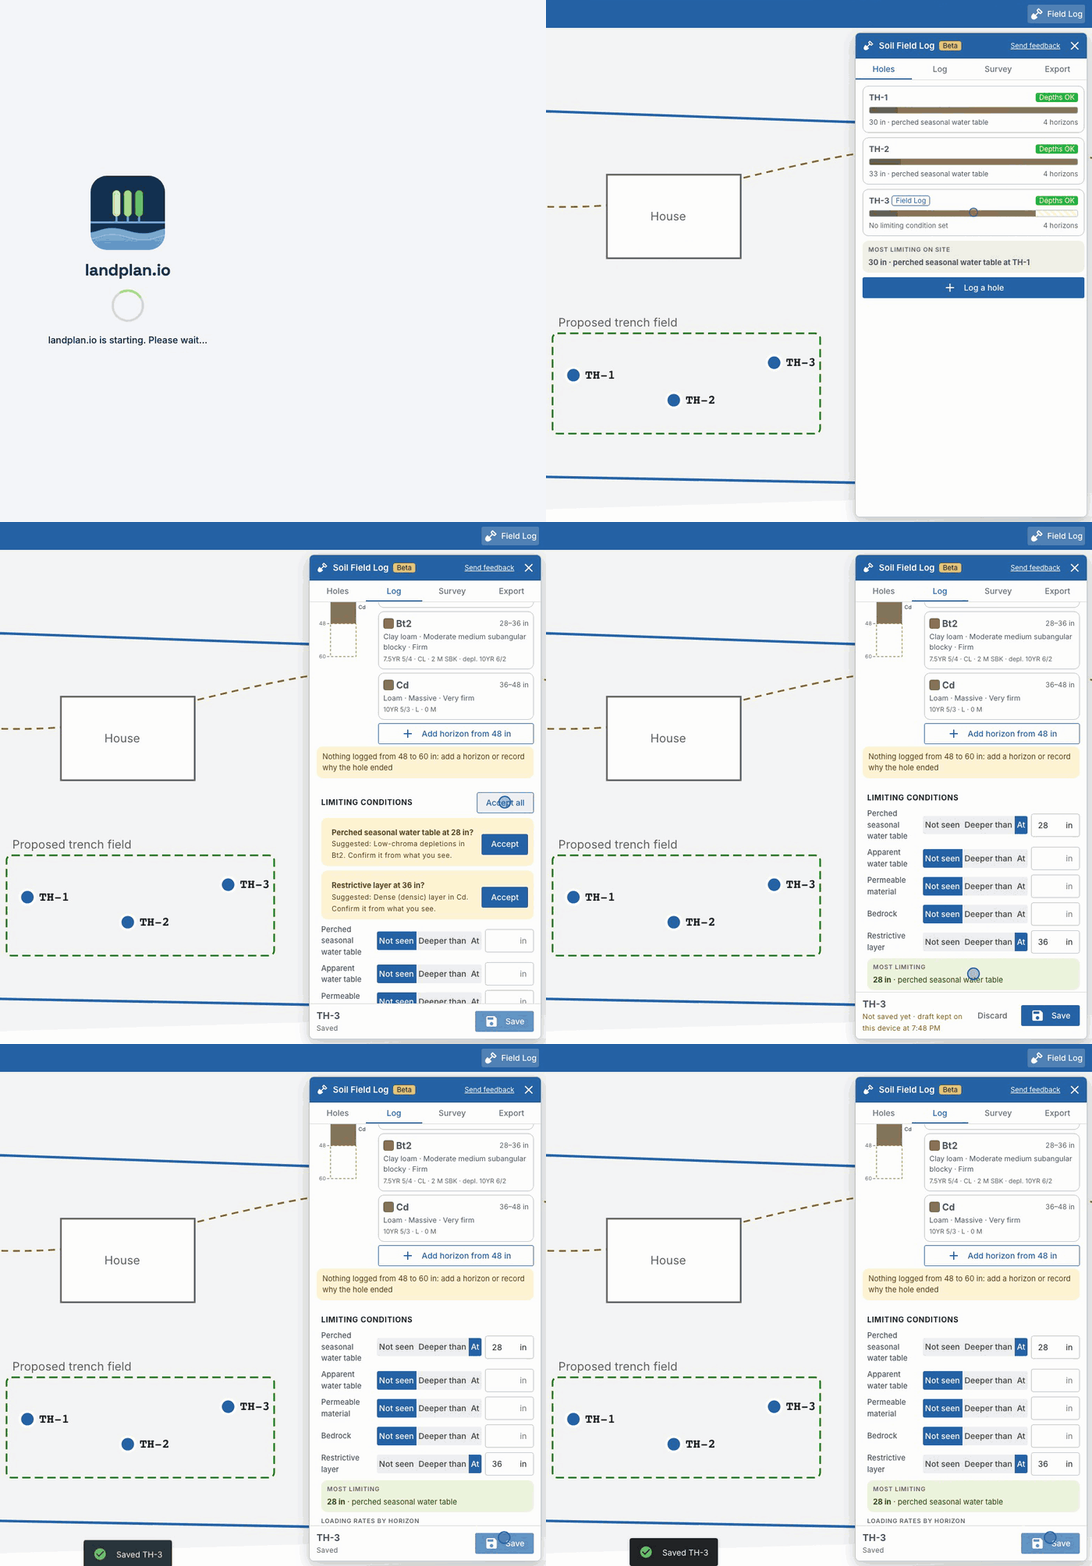
Each suggestion says where it comes from. Choose Accept to use it, Accept all to use them all, or set the condition yourself. Nothing is applied until you accept it. The most limiting condition is shown underneath, with the lowest loading rate your state's table gives for the horizons above it (each horizon's rates with Show all fields). The design's soil analysis still picks the rate by your state's rules.
If you ran a percolation test, open Percolation and click Percolation run. Type the Test depth and its Unit, then click Reading for each reading: the minutes since the last reading and how far the water dropped, in inches. The rate in minutes per inch is worked out from the last (stabilised) reading, and the slowest run is the hole's rate.
Choose Save. Your work is also kept as a draft on your device while you log, so a lost signal or a closed browser doesn't lose it. The hole then appears in the soil test list and is used by the designs like any other soil test.
Compare with the soil survey
The Survey tab shows what the USDA soil survey (SSURGO) maps at the hole. Click the refresh button to read it again.
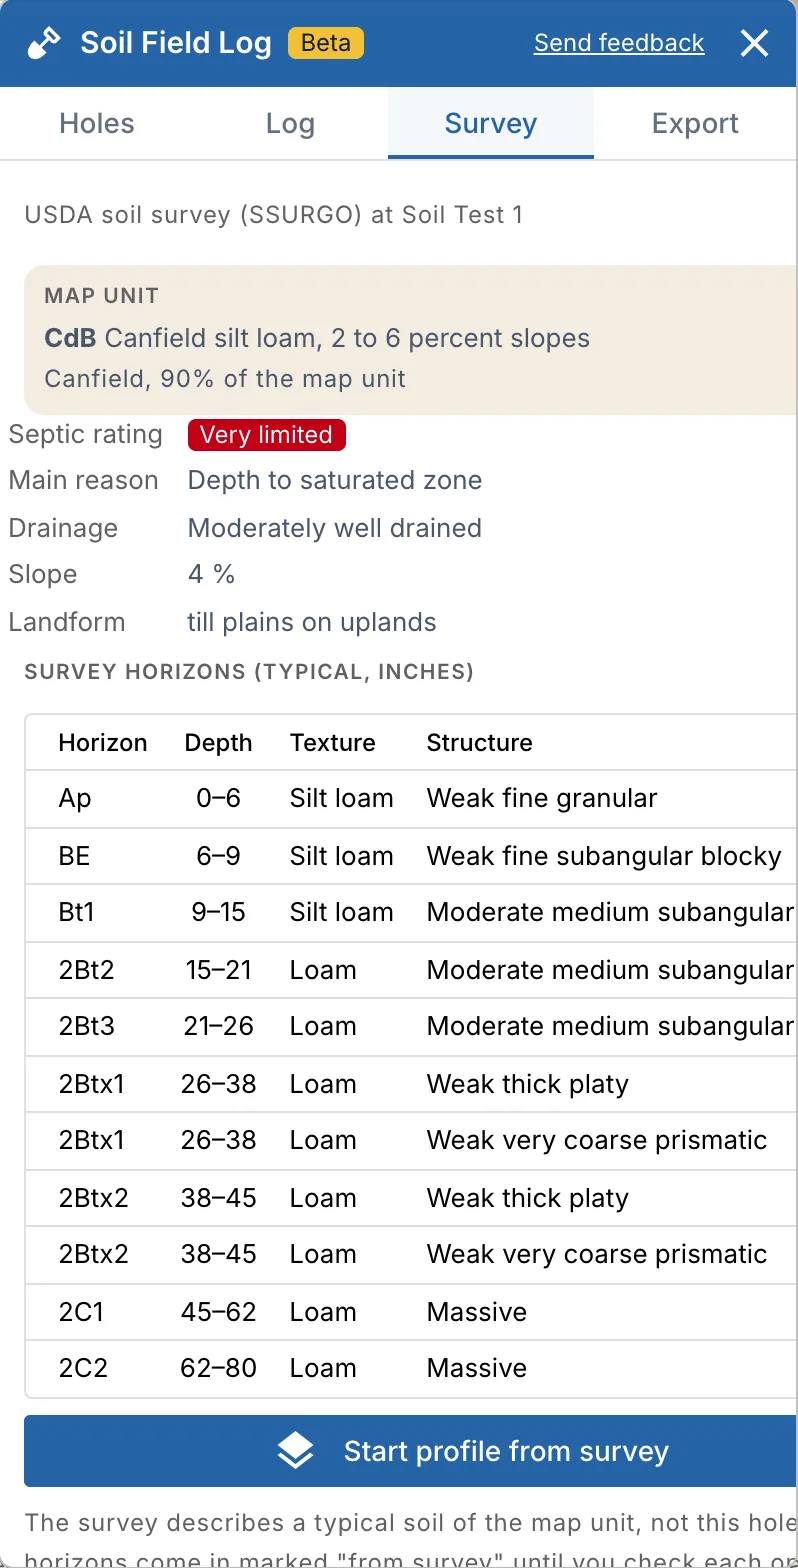
It shows the map unit, its main soil, drainage class and landform, the NRCS rating for septic tank absorption fields with its main reason, and the survey's typical horizons. Start profile from survey fills the horizons from the survey as a starting point, each value marked Survey until you check it. If the hole already has horizons, it asks first: Replace with the survey replaces them. Check and change each one against what you see in the hole.
Export
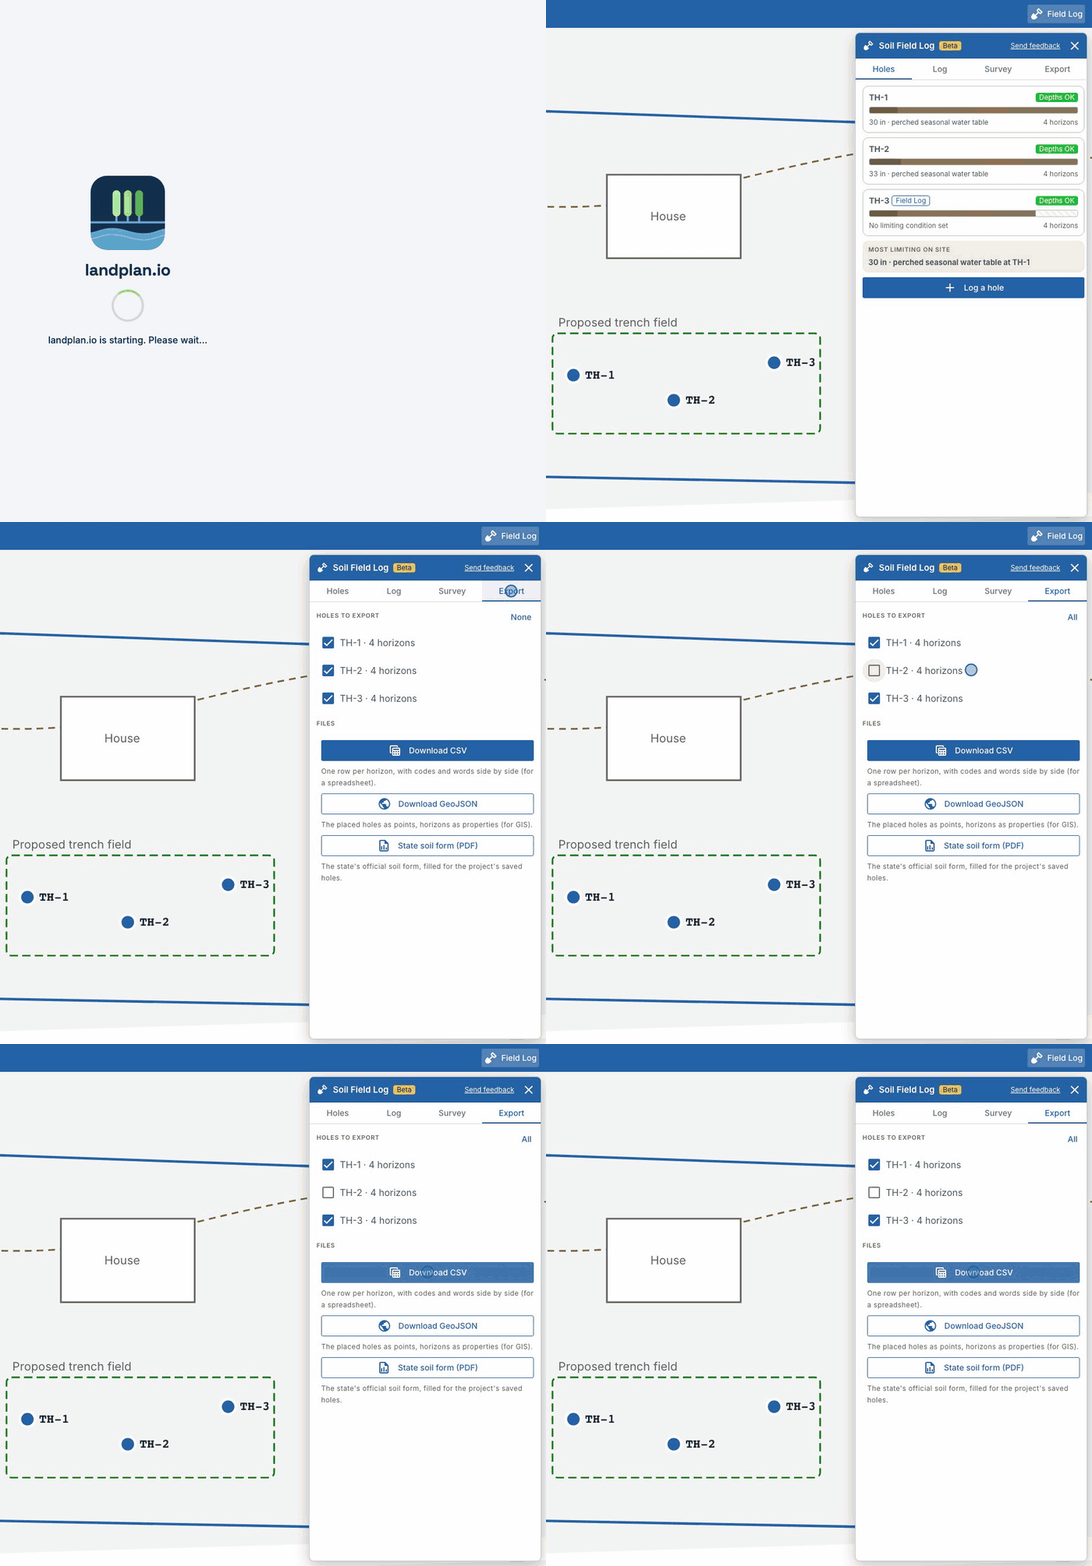
On the Export tab, pick the holes under Holes to export, then choose:
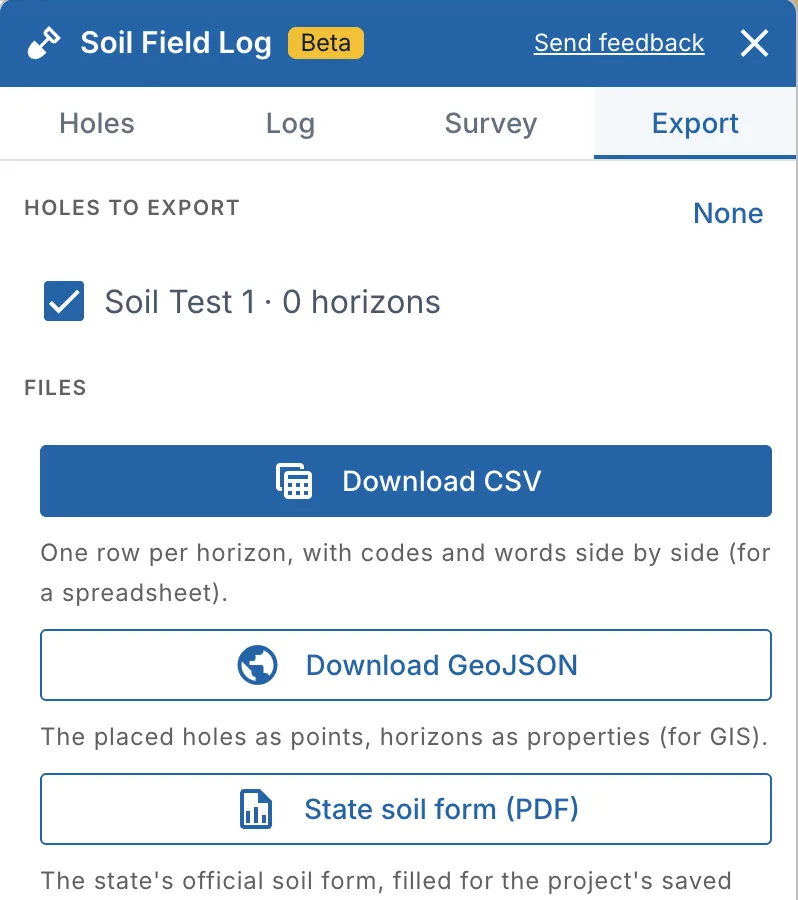
- Download CSV: one row per horizon, with the codes and the words side by side (for example SBK and "Moderate medium subangular blocky").
- Download GeoJSON: the holes as points with their horizons, for GIS software.
- State soil form (PDF): opens the state soil form for the project, filled from the soil tests, as in the soil test list.
On a phone
On a phone, the Field Log is a sheet over the map with three heights: the list of holes, one hole's profile with the map above it, and the full-screen horizon editor. Buttons are large enough to use with gloves, and the main action of each step (Log a new hole, Add horizon, Looks right, Save) is the large blue one.
Works with your existing soil tests
The Field Log and the existing soil tools read and write the same soil tests.
| Existing soil tools | Field Log (beta) | |
|---|---|---|
| Soil tests and horizons | Saved to your project | The same records |
| A hole logged in the Field Log | Shows in the soil test list with a Field Log badge, and opens in the soil test dialog and state forms | — |
| A test entered in the old tools | — | Opens in the Field Log |
| Designs and reports | Use the nearest soil test | Unchanged: they use the same soil tests |
| State soil forms (PDF) | Soil test list › Create Soil Report | Export › State soil form |
Soil science reference
This section summarizes the terms the Field Log uses. It follows the USDA NRCS Field Book for Describing and Sampling Soils. Your state's rules decide how the descriptions are used for a septic design.
Horizons
A soil profile is described as horizons, layers that formed in a similar way. Each one has a designation: a capital letter for the master horizon, then lowercase suffixes for its features. A number in front (for example 2Bt) marks a different parent material.
| Master horizon | What it is |
|---|---|
| O | Organic layer: leaf litter and humus |
| A | Mineral surface layer, darkened by organic matter (Ap when plowed) |
| E | Layer that has lost clay, iron or aluminum, usually lighter in color |
| B | Subsoil where material has accumulated or the soil has changed (clay, iron, structure) |
| C | Material little changed by soil formation, such as glacial till or saprolite |
| R | Hard bedrock |
| Suffix | Meaning | Why it matters for septic |
|---|---|---|
| t | Accumulated clay | Slower water movement |
| g | Strong gleying (gray colors from saturation) | Points to a water table |
| d | Dense, root-restrictive material (for example dense till, Cd) | Restrictive layer |
| x | Fragipan: dense, brittle layer | Restrictive layer |
| m | Cemented | Restrictive layer |
| r | Weathered or soft bedrock (Cr) | Bedrock |
| p | Plowed | Surface layer |
| k | Carbonate accumulation | |
| w | Color or structure development only |
Munsell color
Soil color is recorded with the Munsell system, read from a soil color card:
- Hue is the color family: R (red), YR (yellow-red), Y (yellow). 10YR is the most common hue in soils. The gley pages hold the gray, greenish and bluish colors of saturated soil.
- Value is lightness, from 0 (black) to 10 (white).
- Chroma is strength of color, from 0 (neutral gray) upward.
A color is written hue value/chroma, for example 10YR 5/4 (yellowish brown). Record the color of the moist soil, on a freshly broken face, in natural light, holding the sample behind the card's holes. Screens can't show Munsell colors accurately, so the swatches in the app are only a guide; the card is the reference.
Low chroma (2 or less) below the surface layer usually means the soil stays saturated long enough for iron to be reduced and removed. Dark surface layers can have low chroma from organic matter, so that rule is applied below the A horizon.
Redox features
Repeated saturation and drying move iron and manganese in the soil, leaving redoximorphic features:
- Concentrations: spots, nodules or pore linings where iron or manganese has collected, usually reddish, orange or black (high chroma).
- Depletions: spots or streaks where iron has been removed, gray (chroma 2 or less).
Their amount is recorded by area: few (less than 2%), common (2 to 20%) and many (more than 20%). The shallowest depth with low-chroma depletions is the usual field indicator of the seasonal high water table.
Texture
Texture is the proportion of sand (2 to 0.05 mm), silt (0.05 to 0.002 mm) and clay (less than 0.002 mm). The USDA texture triangle groups the mixes into 12 classes, with subclasses of the sands by sand size (coarse, fine, very fine).
To find texture by feel, moisten a sample to the consistency of putty and:
| Step | What you do | What it tells you |
|---|---|---|
| 1 | Squeeze it in your hand | No ball: sand |
| 2 | Push it out between thumb and finger | No ribbon: loamy sand |
| 3 | Measure the ribbon before it breaks | Less than 1 in: a loam · 1 to 2 in: a clay loam · more than 2 in: a clay |
| 4 | Rub a wet pinch in your palm | Very gritty: sandy · very smooth: silty · neither: loam, clay loam or clay |
| Ribbon | Very gritty | Very smooth | Neither |
|---|---|---|---|
| Less than 1 in | Sandy loam | Silt loam | Loam |
| 1 to 2 in | Sandy clay loam | Silty clay loam | Clay loam |
| More than 2 in | Sandy clay | Silty clay | Clay |
Rock fragments add a modifier by volume: less than 15% no modifier; 15 to 35% gravelly, cobbly, channery and so on; 35 to 60% "very" (very gravelly); 60 to 90% "extremely". Gravel is 2 to 75 mm, cobbles 75 to 250 mm, stones 250 to 600 mm and boulders larger than 600 mm. Channers and flagstones are flat fragments.
Structure
Structure is how soil particles hold together in aggregates (peds). It's written grade, size, type, for example moderate medium subangular blocky.
| Classes | |
|---|---|
| Grade | 0 structureless · 1 weak · 2 moderate · 3 strong |
| Size | very fine · fine · medium · coarse · very coarse · extremely coarse (platy structure: very thin · thin · thick) |
| Type | granular · subangular blocky · angular blocky · platy · prismatic · columnar · cloddy; structureless soil is single grain (sand) or massive |
Strong granular and blocky structure lets water move between peds. Platy and massive layers slow it down, which is why structure is part of the loading rate.
Consistence
Moist consistence is how easily a moist ped crushes between thumb and finger: loose, very friable, friable, firm, very firm, extremely firm. Very firm and extremely firm massive material is usually restrictive.
Limiting conditions
A septic system needs a depth of suitable, unsaturated soil under it. The limiting conditions are what cut that depth short:
| Condition | What it is |
|---|---|
| Perched seasonal water table | Saturation that sits above a slowly permeable layer for part of the year, found from redox features |
| Apparent water table | Free water that stands in the open hole at the level of the water table |
| Restrictive layer | A layer that water and roots pass slowly: fragipan, dense till, cemented pan |
| Bedrock | Hard (R) or weathered (Cr) rock |
| Permeable material | Very coarse material, such as clean sand or gravel, that passes effluent too fast to treat it |
Each one is recorded with its depth and whether it was found at that depth (=) or not found above it (>). The shallowest one is the most limiting. Your state sets the vertical separation a system needs above it.
Loading rates
Loading rates say how much effluent the soil can accept:
- ILR / LTAR (infiltrative or long-term acceptance rate): gallons per day per square foot of trench or bed bottom.
- LLR (linear loading rate): gallons per day per foot along the contour, used where water moves sideways over a shallow limiting condition.
They come from your state's tables, which use the texture, structure and sometimes consistence of the horizon where the system goes, the slope, and the depth to the limiting condition. The Field Log looks them up for each horizon as you log it.
Soil survey data
The USDA soil survey (SSURGO) maps soils as map units at a scale of about 1:12,000 to 1:24,000. Each map unit is named for its main soils (components) and can contain small areas of other soils. The survey's septic tank absorption field rating is not limited, somewhat limited or very limited, with the main reasons (for example depth to saturated zone or slow water movement).
The survey is a good guide to what to expect before you dig. It is not site-specific: the field evaluation of the hole decides.
Questions
Will entries made in the beta be lost if the beta is turned off? No. The Field Log saves ordinary soil tests. If the beta is turned off, they stay in your project and open in the existing soil tools.
Does it work without signal? The hole you're logging is kept as a draft on your device until you save it. Full offline use (preparing a project for the field and syncing later) is planned.
Where do state soil forms come from? From the same state forms as the soil test list: Export › State soil form opens them, filled from your soil tests.
Who can see the beta? Your landplan.io administrator decides. If you don't see Field Log in the Soil tools, it isn't turned on for your account yet.