
Details and the Report PDF
Details (the design calculator) holds every number behind the design on the map: the daily flow, the soil loading rates, the area the system needs, the elevations, the pump and the dosing. It also makes the report PDF, the plan set you hand in.
Details reads the parts you drew on the map, or the parts Smart design and Auto design placed for you. You go through it in four steps:
| Step | What it covers |
|---|---|
| 1 Flow & Sizing | The daily design flow, the soil, the tanks and the absorption area. |
| 2 Elevations | The building sewer, the tanks and the soil absorption system, from a benchmark. |
| 3 Pressure & Pump | The force main, the zones, the pump and the dosing. Only systems with a dose tank have this step. |
| 4 Report | The pages of the report, the cost estimate and the PDF. |
Open Details
Click Details (the calculator icon) in the bar at the top of the map. It sits next to Design and Print once a project is open.
- On a phone, open the ⋮ menu and choose Design details (calculator).
- In Smart design, click Details in the panel's footer, or click a step in the guide's step bar.
Details opens at the step the design is on:
| Smart design step | Details opens at |
|---|---|
| Home | Flow & Sizing, Flow |
| Soil | Flow & Sizing, Soil |
| System, Spot | Flow & Sizing, Absorption area |
| Tanks | Flow & Sizing, Tanks |
| Pipes | Elevations, or Pressure & Pump when the system has a dose tank |
| Review | Report, Report pages |
Site in the step bar doesn't open Details: it shows the site in Smart design (the soil, water, sewer and aerial imagery notes), and the back arrow returns to the design. Until every part listed under Finish the design first is on the map, a step in the bar keeps Smart design open instead: Soil shows the site notes, and the other steps say what comes next. Details in the panel's footer still opens the Finish the design first window.
Details needs a Pro plan or a plan credit. Without one, the Some Major Issues Need Resolved window opens and asks you to upgrade to Pro or buy a plan credit.
When parts are missing
Details open with parts of the design still missing, once the house and its daily flow are on the map. A checklist over the steps, Details · 4 of 6 parts drawn, lists every part: the ones drawn in one line, and each missing one, such as the mound and the force main, with:
- Add it for me, which places the part around what you drew. Sizing and the cost estimate fill in as the parts arrive.
- Draw it, which closes Details and starts the part's map tool, with a hint such as Start at the house wall, double-click at the tank. Open Details again when you are done.
The soil, flow and site parts of Details work in the meantime. The parts come from the system you picked in Smart design; without one, the list is the house, the sewer main, the tanks and the absorption area, and Add it for me on the absorption area opens Smart design to pick the system.
When the house or its daily flow is missing, Details can't open yet: the same checklist opens in a window, with Bedrooms to say where the bedrooms come from (an estimate from the size of the house on the map, or 3 for a typical house, or Enter the number). Once the house is added, click Open Details. Open Smart design takes you to the guide instead.
The Details screen
How Details opens depends on your screen:
- On a computer, from the map, it docks beside the map, so you can see the design while you work.
- On a phone, it opens as a sheet from the bottom of the screen. Tap the handle at the top to make it half height and see the map above it. Swipe down from half height to close it.
- Anywhere else, it fills the screen.
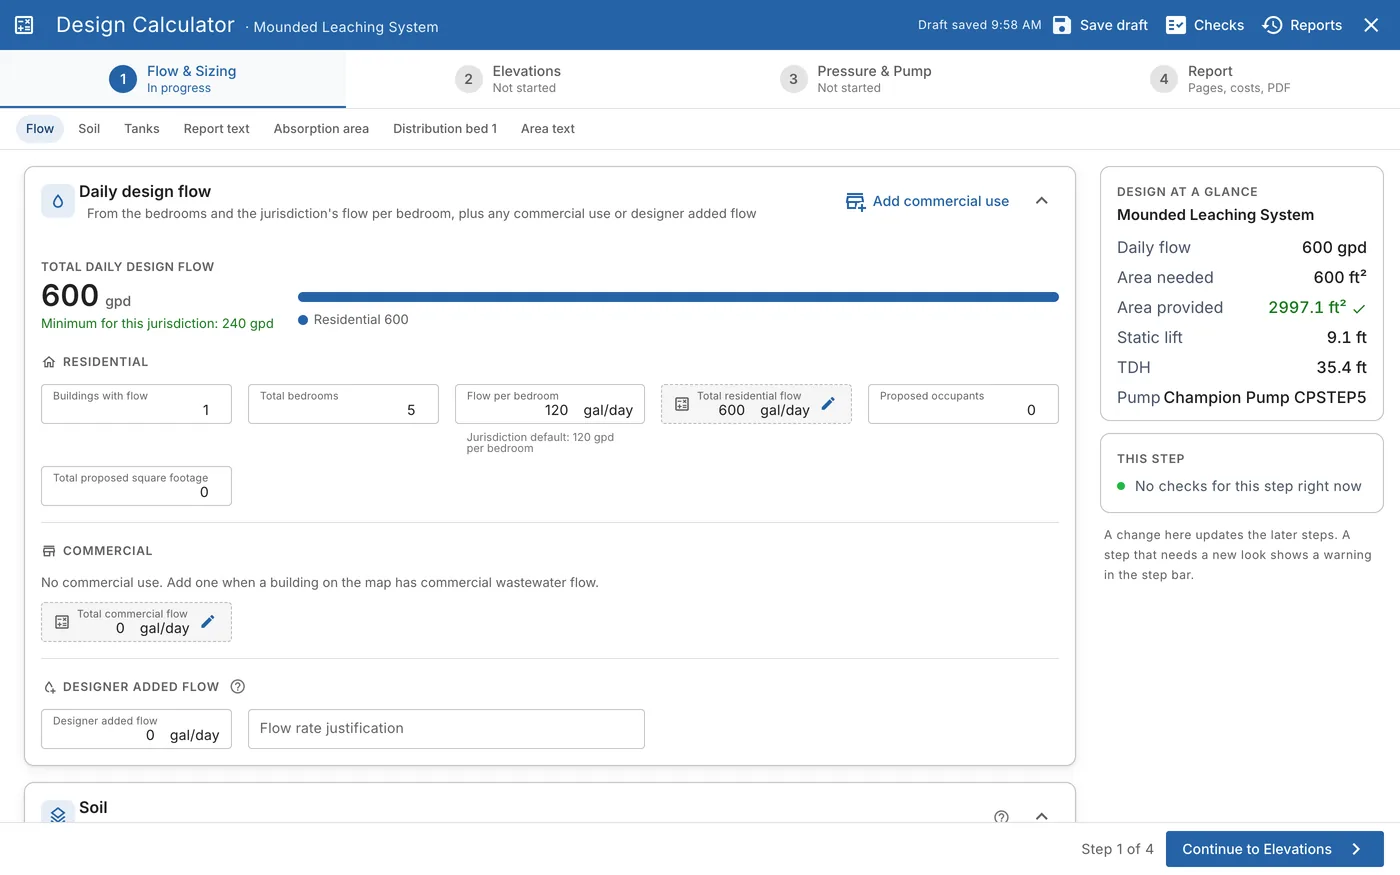
The title bar reads Details and the system, such as Mounded Leaching System. (Opened from elsewhere, it reads Design Calculator.) It has:
| Button | What it does |
|---|---|
| Guide | Goes back to Smart design on the map, with how far the design has got. |
| Save draft | Saves the report as a draft now. It also saves as you move between steps, and shows Draft saved 9:58 AM. A draft is not a version: only generating the PDF adds one. |
| Checks | Opens the checks. The badge counts the checks to review. |
| Reports | Goes to the opening screen, to start a new report or open a version. |
| ✕ | Closes Details. If something isn't saved, it asks first. |
The step bar
The step bar shows the four steps. Click a step to go to it. Under each step's name, a caption says how it stands:
| Caption | Meaning |
|---|---|
| Not started | You haven't opened the step yet. |
| In progress | The step you are on. |
| A result, such as 600 gpd · 2997.1 ft² or Lift 9.1 ft | The step is done. The result is its main number. |
| 2 to review | Checks point at this step. They don't stop the report. |
| Must fix or a warning | Something on the step must change before you can generate the report. |
A step can also show a warning with a button to fix it:
| Warning | Button |
|---|---|
| The flow changed: update the design | Update the design |
| The pressure network changed: update the pump | Update pump |
| No pump selected | Find a pump |
Under the step bar, links jump to each section of the step, such as Flow, Soil, Tanks and Absorption area. The link of the section on screen is marked.
The right side
On a wide screen, a panel on the right shows Design at a glance: the system, the daily flow, the area needed, the area provided (with a tick when it is enough), and for a pumped system the static lift, the TDH and the pump. Under it, This step lists the checks for the step you are on.
A change on one step updates the steps after it. A step that needs a new look shows a warning in the step bar.
The footer
The footer has Back, Step 2 of 4 and Continue to Elevations (the name of the next step). On the last step, the button is Generate report PDF.
Step 1: Flow and sizing
Step 1 works out how much wastewater the system must take and how big the absorption area must be.
Daily design flow
The top of the section shows the Total daily design flow, for example 600 gpd, and the smallest flow your jurisdiction allows (Minimum for this jurisdiction: 240 gpd). A bar shows how much comes from each use.
| Field | What it is |
|---|---|
| Buildings with flow | The number of houses (Building With Flow) on the map. |
| Total bedrooms | The bedrooms of those houses. |
| Flow per bedroom | Your jurisdiction's flow per bedroom, for example 120 gpd per bedroom. |
| Total residential flow | Bedrooms × flow per bedroom. Click the pencil to enter your own value. |
| Proposed occupants, Total proposed square footage | Used where the jurisdiction sizes by occupants or floor area. |
| Total commercial flow | The flow of commercial uses. Click Add commercial use to add a commercial flow type to a building. |
| Designer added flow and Flow rate justification | Extra flow you add, and why. |
Soil
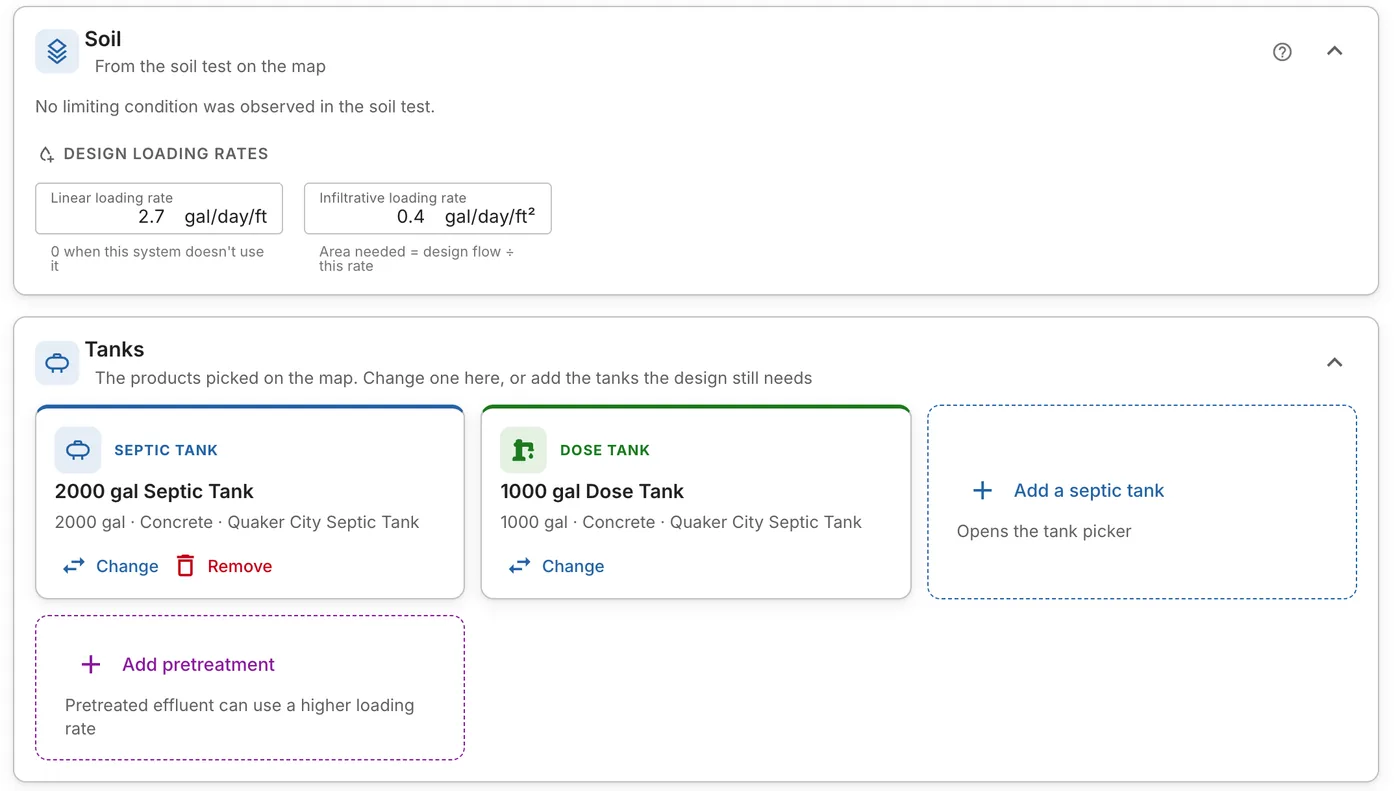
The soil comes from the soil test on the map. To use another soil test, change it on the map.
- Most limiting condition. The depth observed, the vertical separation needed and the in-situ soil needed, as your jurisdiction sets them. When the soil test has no limiting condition, the section says so.
- Design loading rates. The Linear loading rate (gal/day/ft) and the Infiltrative loading rate (gal/day/ft²). The area needed is the design flow ÷ the infiltrative loading rate.
- The soil profiles of the test, with each layer's depth, class, grade and loading rates.
Tanks
The tanks show as cards with the product, size and material. Click Change to pick another product, or Remove to take it out. The empty cards add a part:
- Add a septic tank opens the tank picker.
- Add pretreatment. Pretreated effluent can use a higher loading rate.
- Add a dose tank. This adds the Pressure & Pump step.
Report text
System description prints on the footer of every page of the report. Residential flow calculation (and Commercial flow calculation) print on the calculations sheet. Change the wording here.
Absorption area
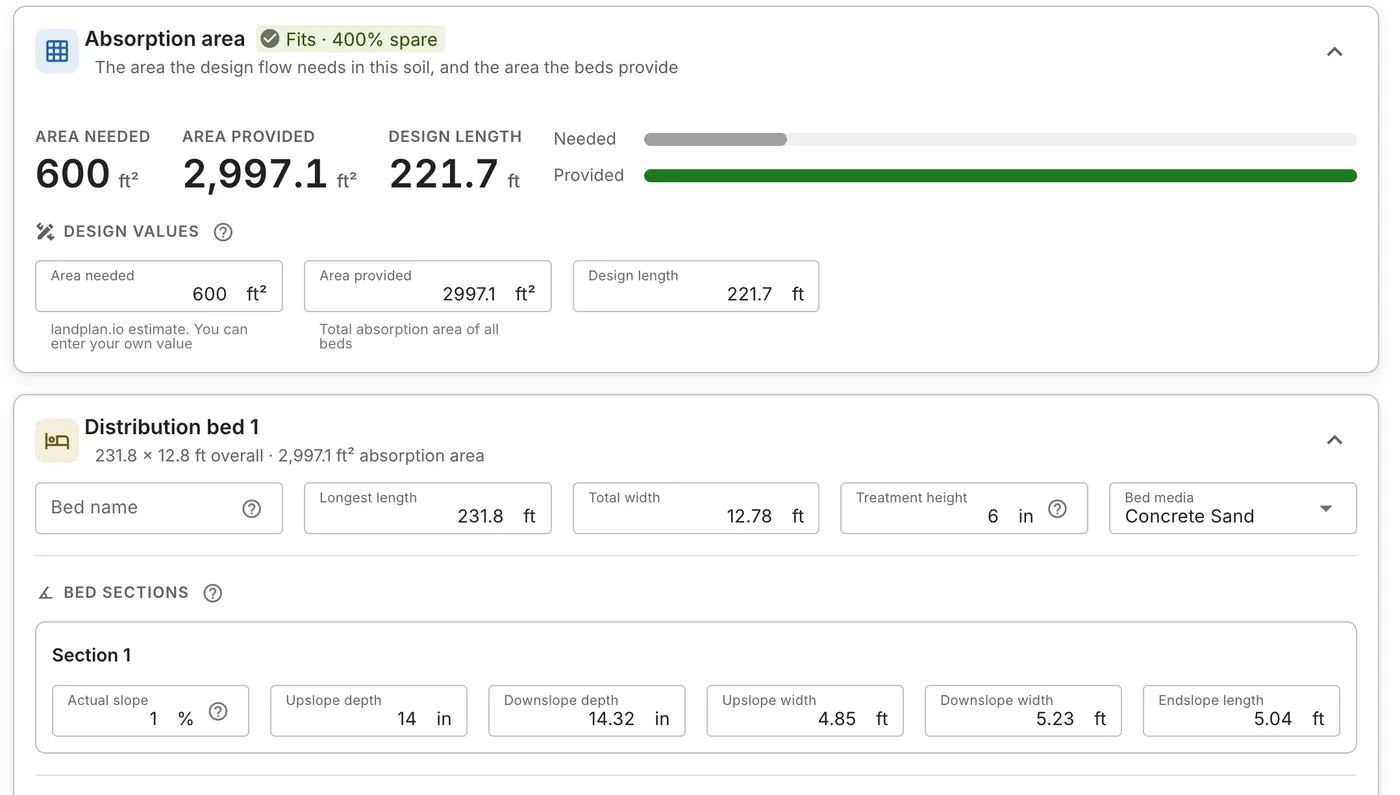
The section compares Area needed with Area provided, and gives the Design length. The badge says whether it fits, for example Fits · 11% spare, or how much it is short by. For a mound both are the absorption bed, its length × width, not the basal area under the mound.
The area needed is landplan.io's estimate. You can enter your own value under Design values.
Each bed has its own card, such as Distribution bed 1, with:
- Longest length, Total width, Treatment height and Bed media.
- Bed sections: the actual slope, the upslope and downslope depths and widths, and the endslope length.
- Trenches: the trenches in the bed, with their sizes.
Area text holds how the area was worked out, as it prints on the calculations sheet. Change the wording here.
Step 2: Elevations
The elevations draw the hydraulic profile sheet (HP-1). Fill them from a benchmark when the site has one.
| Section | What you enter |
|---|---|
| Benchmark | Tick The site has a benchmark, then its description and elevation. |
| Building sewer | The Depth to sewer invert where the sewer leaves the building, and the Sewer minimum fall. Add sewer main adds another sewer main into the first tank, from a level reading. |
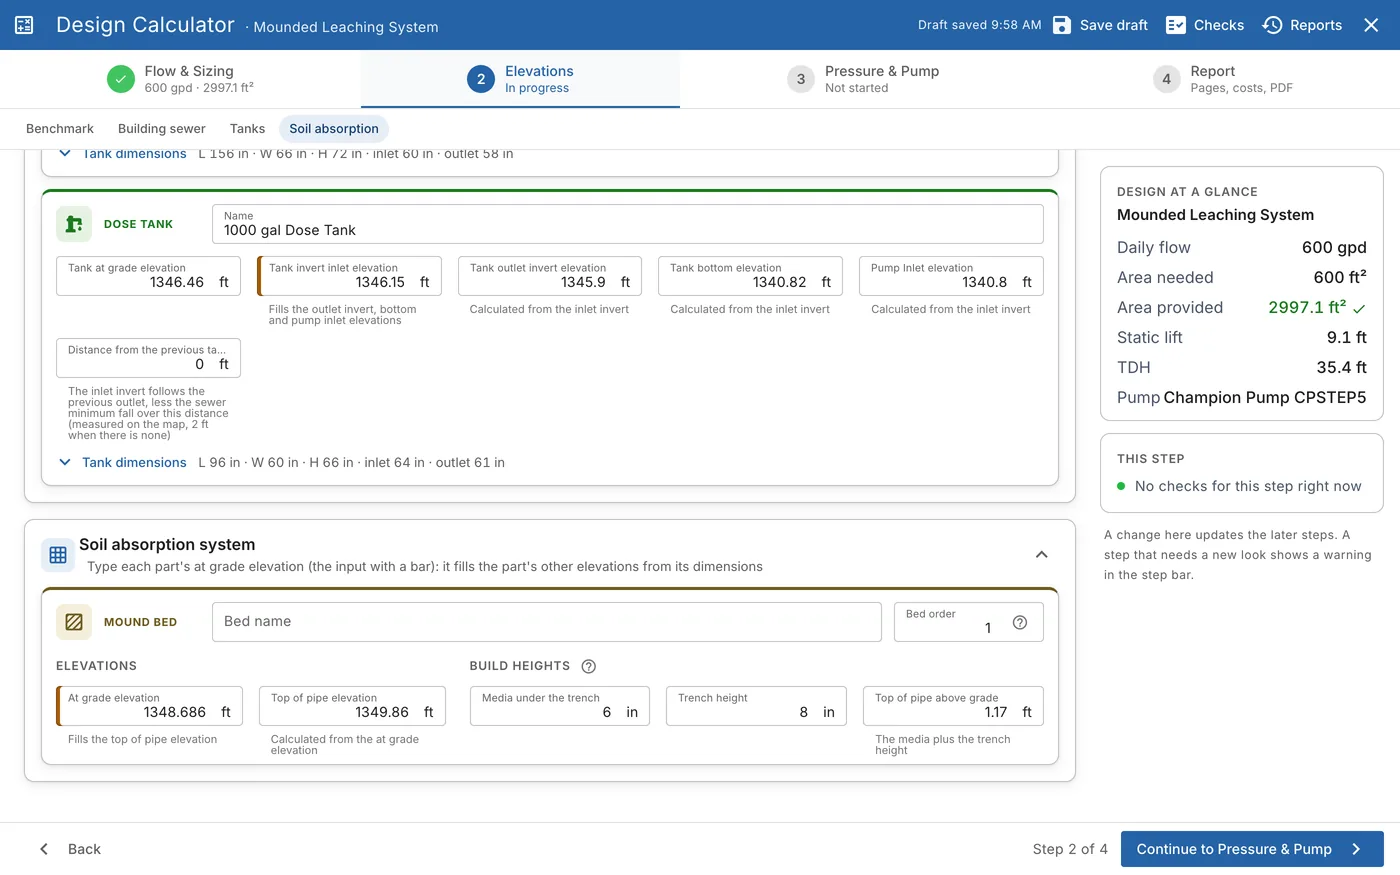
| Tanks | For each tank: the at grade elevation, the inlet and outlet inverts, the bottom, the pump inlet (dose tank), the distance from the previous tank and the tank's dimensions. |
| Soil absorption system | For each bed or trench: the at grade elevation and the build heights. |
| Discharge point | For a discharging system: the elevation and description of the discharge point. |
You don't need to type every elevation. Type the one in the field with a bar on its left, and Details fills the rest from the part's dimensions:
- For a tank, type the Tank invert inlet elevation. It fills the outlet invert, the bottom and the pump inlet.
- For a bed, type the At grade elevation. It fills the top of pipe elevation.
The inlet invert of each tank follows the outlet of the tank before it, less the sewer's minimum fall over the Distance from the previous tank.
Tank above grade
If the elevations put the top of a tank above the ground, the step warns The tank elevations show the tank will be above grade. The tank may need soil cover.
Step 3: Pressure and pump
Only systems with a dose tank have this step. It works out what the pump has to do, picks a pump, and sets the dose and the floats.
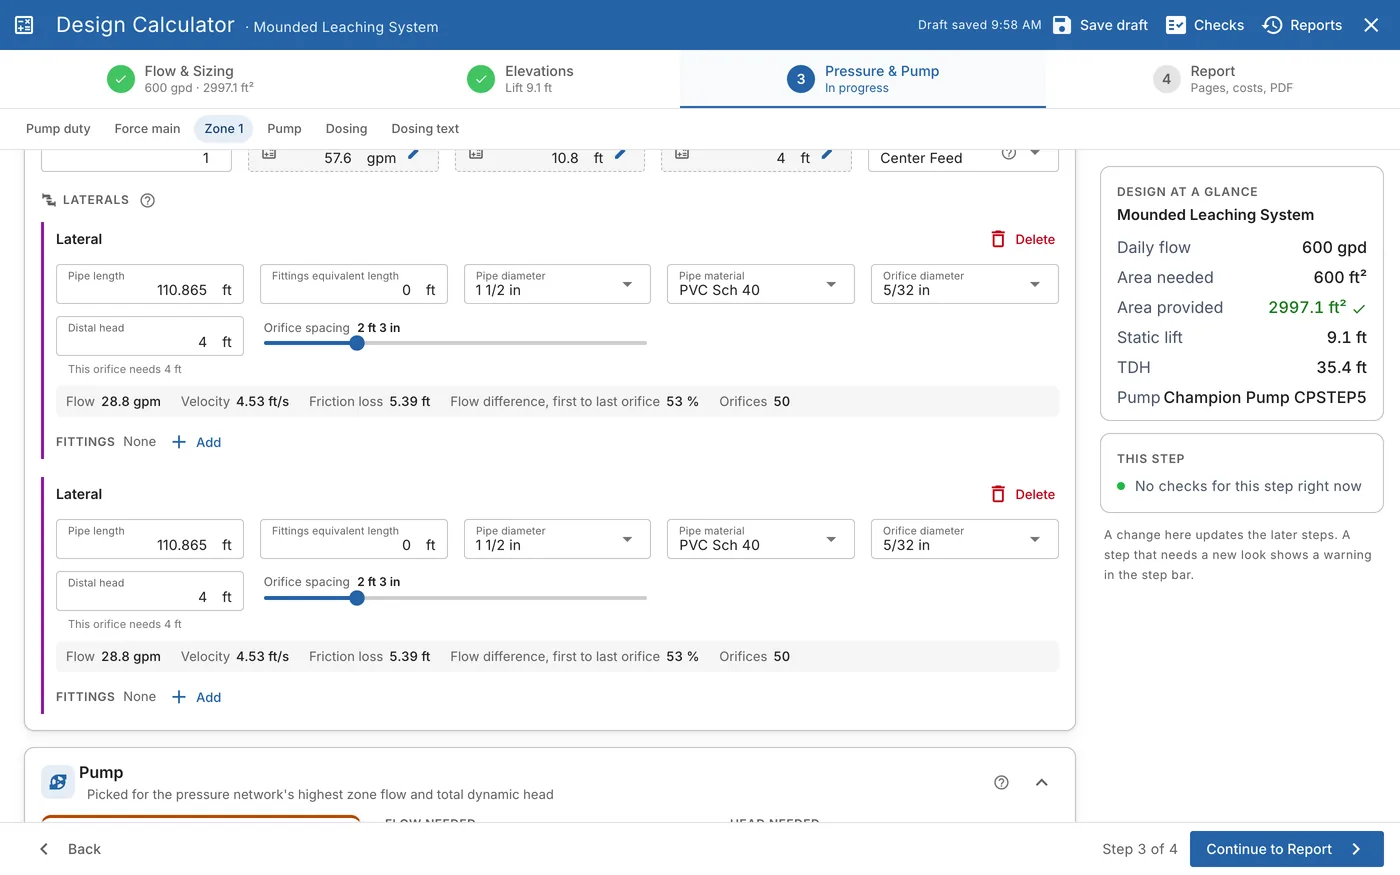
| Section | What it holds |
|---|---|
| Pump duty | The required flow, the total dynamic head (TDH) and the static lift. |
| Force main | The pipe from the pump to the valve or the zone: flow, velocity, friction loss, length, diameter and fittings. |
| Valve | The valve that splits the doses between zones, when there is one. |
| Zone 1, Zone 2... | Each zone's laterals, manifolds, drip runs or spray heads. |
| Pump | The pump picked for the network, and its pump curve. |
| Dosing | The dose method, the dose, the dose tank and the floats. |
| Dosing text | The calculations printed on the dosing detail sheet. |
See Pressure and Pump for each section, its Pump section to change the pump and read its curve, and Dose Tank and Floats for the dosing.
Step 4: Report
Step 4 sets up the report PDF and the cost estimate.
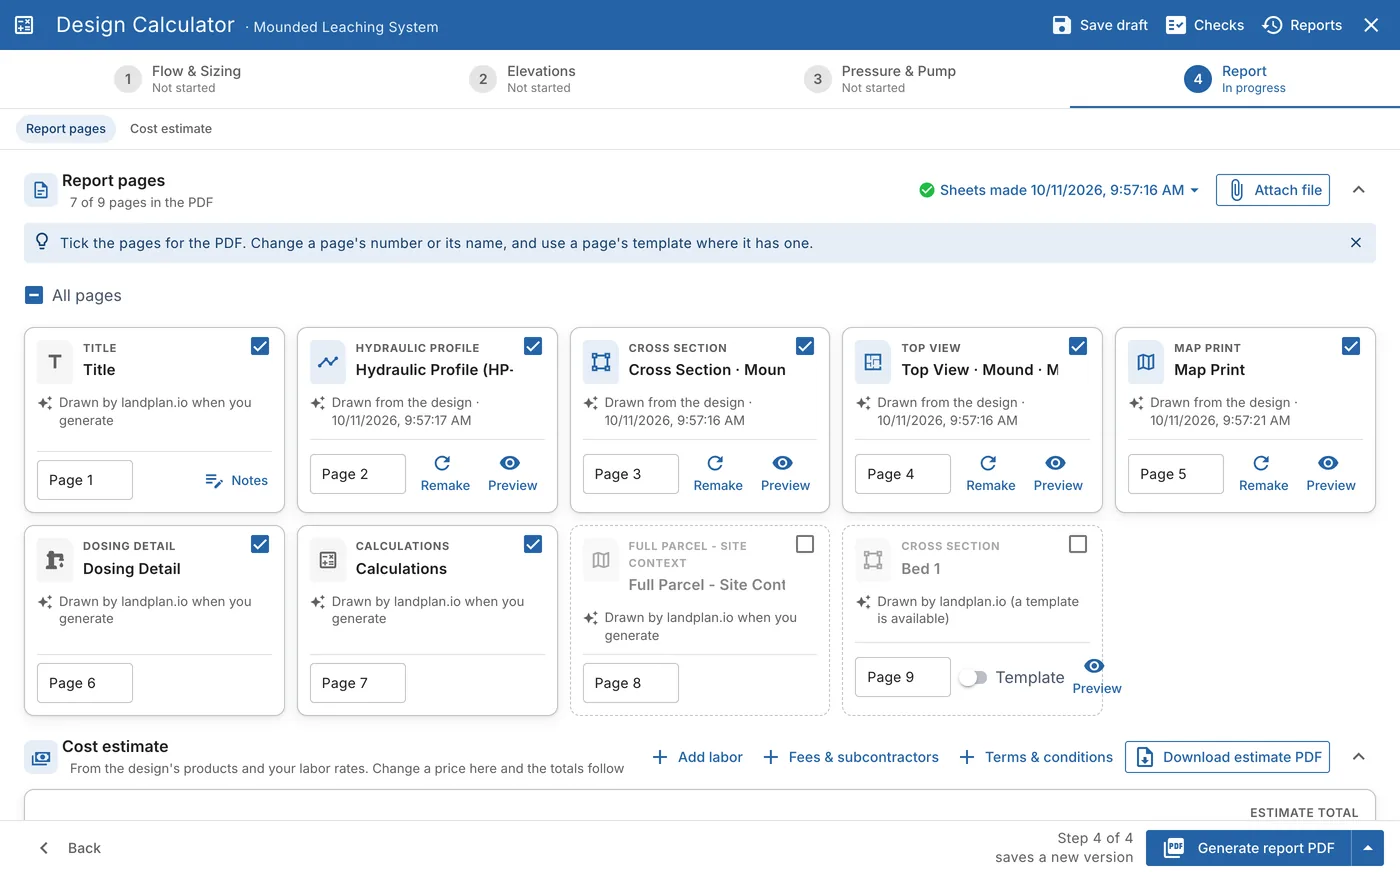
If checks are waiting, a banner at the top says how many, with View checks.
Report pages
The section lists every page that can go in the PDF, and says how many are in it, for example 7 of 9 pages in the PDF. Each page has a card:
- The tick puts the page in the PDF or leaves it out. All pages ticks or clears them all.
- The page number sets where it goes.
- The name is what the page is called on the report. Change it on the card.
- Notes (on the Title page) edits the construction notes.
- Template uses your own file for the page, where it has one.
- Preview shows the page.
- Remake draws the page again from the design.
Under each name, the card says where the page comes from: Drawn from the design and the date it was drawn, or Drawn by landplan.io when you generate.
Attach file adds a PDF or an image to the end of the report. When your configuration adds product spec sheets, they go at the end too.
Sheets from the design
The cross sections, the hydraulic profile (HP-1), the map print, the system detail and the site topography are drawn from the design. The button at the top of Report pages says when they were made (Sheets made 10/11/2026, 9:57 AM), or Making sheets… while they are drawn. Click it for:
- Make the cross sections now. One to-scale sheet per system on the map.
- Add the hydraulic profile (HP-1), from the building to the soil absorption system.
- Add the system detail (enlarged). The system at a closer scale, named and measured, with design notes.
- Add the site topography. The parcel and the system over the site's contours and elevation shading.
- Make them when the Report step opens. A switch. Generating the PDF always makes them again.
Making a sheet again replaces the one made before. Files you attach yourself are never replaced.
County forms
When the project's county has its own forms for plans, a County forms box lets you choose County forms, then the plan, County forms only or Plan only. The report fills the forms from the project, the design and the soil logs.
Cost estimate
Under the report pages is the cost estimate: the products of the design, your labor, fees and terms, and Download estimate PDF. See Cost Estimate.
Checks
The checks come from your area's rules and your validation settings. They update as you change the design. Click Checks in the title bar to see them all in one list:
- Must fix. A step that must change before you can generate the report. Click Fix in and the step's name to go there.
- To review. Checks that don't stop the report, but print on it until you fix them. Each has a Fix in button for its step, or Go to Report pages.
When nothing is left, the list says All checks passed.
Fix it
The hydraulic profile (HP-1) and cross section checks that don't pass come with help to clear them:
- Check these inputs first. Values that look wrong are flagged before any fix is offered: a required vertical separation over 48" (Did you mean 12"?, with a button to use it), a limiting condition entered above the ground, a soil test with no limiting condition, or a tank entered feet above the ground. Open goes to where the value is edited.
- One card per cause. Checks that share one cause are one card, with the checks it explains folded under it. For example, a field entered about 8 ft above the ground makes the header climb to it, come out of the ground, and read a negative cover and separation: that is one card, The field sits about 8 ft above grade, that explains them all. A check no cause explains keeps its own row.
- Fix it. Each card lists its fixes, best first. A fix that changes a number shows the old and the new value (Trench 1: pipe invert 1499.79 → 1489.92) and how many of the card's checks it clears. A check on its own has its fix under it, or what to do by hand.
- Fix it for me. Applies the card's best fix. It waits while an input is flagged, so the checks never pass on a wrong plan. When no fix works, the card says why (for example, no elevation lets the field fall by gravity and keep its separation).
Every fix is one step: the message after it has Undo for 10 seconds, and says what still fails once the checks are read again. A fix that leaves work for the installer, such as fill over a line, is added to the report's construction notes.
Generate the report PDF
On step 4, click Generate report PDF. The button reads Making sheets… while the sheets from the design are drawn. Next to it, the footer says how many checks are left and that the PDF saves a new version.
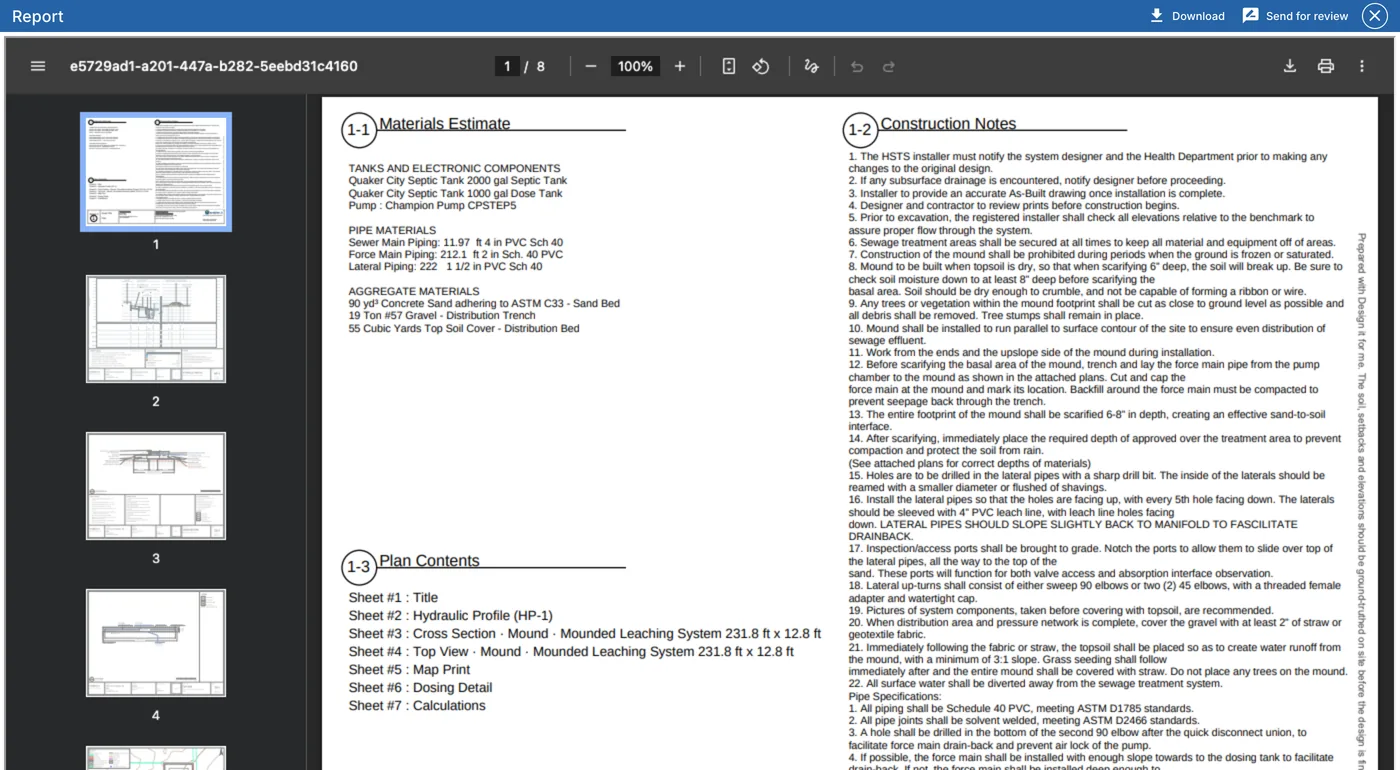
The PDF opens in the Report viewer. Click Download to save it. The viewer also has page thumbnails, zoom and print.
You can also make the report without opening Details:
- Smart design. Click Download report PDF in the panel's footer once every part is on the map.
- Auto design. Tick Make the report PDF when it's done. Include the cost estimate adds the estimate.
Cross section
The cross section is the system cut across its absorption area, to scale: the trenches or the bed, the media, the sand and the cover, over the existing soil and the soil test's limiting condition. The report prints one per system on the map, as Cross Section (CS-1).
To open it, click Contour in the System group and choose the system under Edit, or click Open in cross section in a drawn system's properties. The editor opens full screen on the Section view. Its other views are Top view, Run profile (drip only), Hydraulic profile and Sheet, the page as it prints.
- Change a value. Select a part, then type in the Design form, drag a grip, or click a blue dimension in the drawing.
- Check it. Checks on the left rail lists what passes and what needs attention. From defaults lists the values that came from your area's configuration because the design doesn't set them.
- Export it. The export menu has Sheet, PDF at Letter or 17 × 11 to scale, Sheet, SVG and the view on its own as an SVG.
- Keep it. Click Regenerate System to draw the changed system on the map again.
The report's CS-1 sheets are drawn again from the design each time the report is made. See Contour Systems for every field of the editor.
Hydraulic profile
The hydraulic profile is the flow path seen from the side: the building, the sewer, the tanks, the pump and the force main, and the soil absorption system, over the existing grade. It prints as Hydraulic Profile (HP-1), drawn from the elevations of step 2.
Open a drawn system in the cross section editor (see Cross section) and click the Hydraulic profile view. It shows only for a system already drawn on the map.
- Change an elevation. Drag a tank, the distribution box, the trench or bed, or a spray head up or down, or use the arrow keys on its grip (Shift moves 0.1'). Click a part to type its elevation. The profile is worked out again as it moves, and the elevation is saved to the design. Undo takes it back.
- See where a value comes from. Click a part. Where the values come from marks each value measured (the Elevations step), entered, config (your area's rules), derived or default.
- Check it. Checks lists the profile's checks, such as each line's slope against the minimum fall and the cover over each tank and pipe. The same checks count in the Checks of Details and print on HP-1.
- Export it. PDF at Letter or 17 × 11 to scale, or SVG.
Add HP-1 to the report with Add the hydraulic profile (HP-1) under Sheets from the design.
The report sheets
These are the sheets of a report for a pumped mound, in their default order. Which sheets you get depends on the system: a gravity system has no dosing detail, for example.
Title
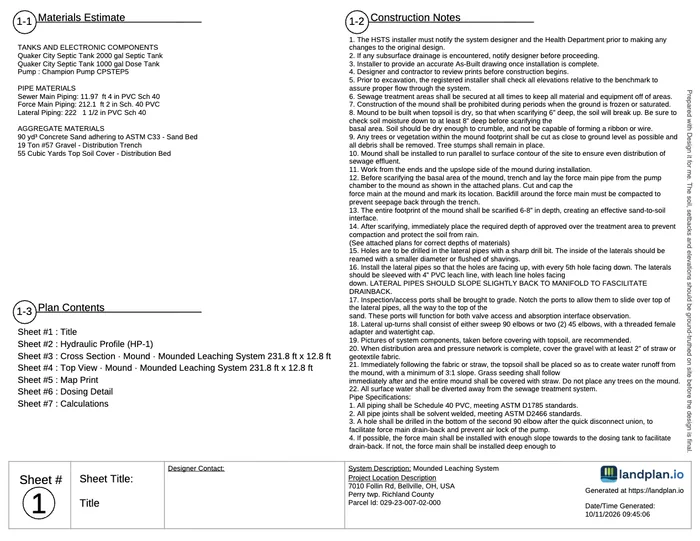
- Materials estimate: the tanks and pump, the pipes and the aggregate, with their quantities.
- Construction notes: your jurisdiction's notes. Edit them with Notes on the Title card.
- Plan contents: the list of sheets.
- The title block, as on every page: the designer, the project location and parcel, the system description and the date generated.
Hydraulic Profile (HP-1)
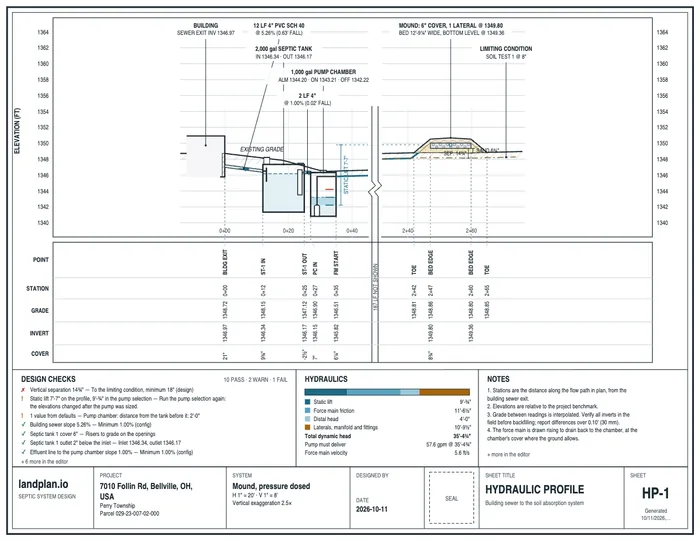
The flow path from the building to the soil absorption system, seen from the side: the house, the sewer, the tanks, the force main and the bed, over the existing grade. Under the profile, a table gives each point's station, grade, invert and cover. The sheet also has the design checks, the hydraulics (static lift, friction losses and the total dynamic head), notes, and the horizontal and vertical scales. It is drawn from step 2.
Cross Section (CS-1)
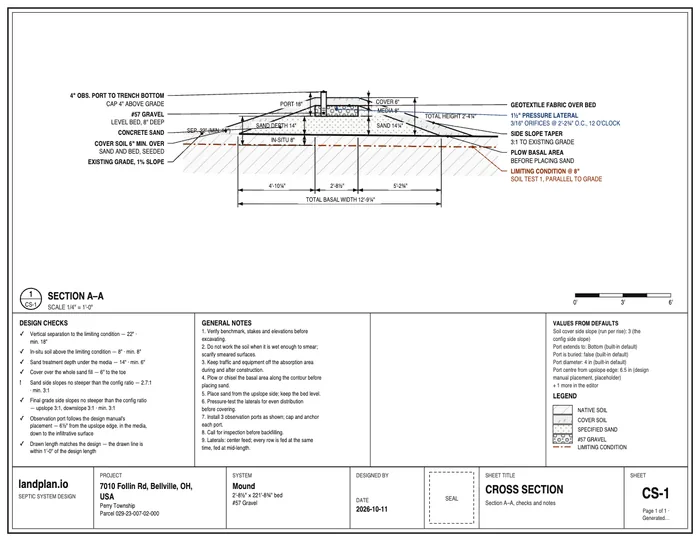
Section A–A through the absorption area, to scale. Callouts name each layer (gravel, sand, cover soil, the lateral and its orifices) and dimensions give its depths and widths. The sheet also has the design checks, general notes, the values that came from defaults, and a legend. There is one cross section per system on the map.
Top View (TV-1)
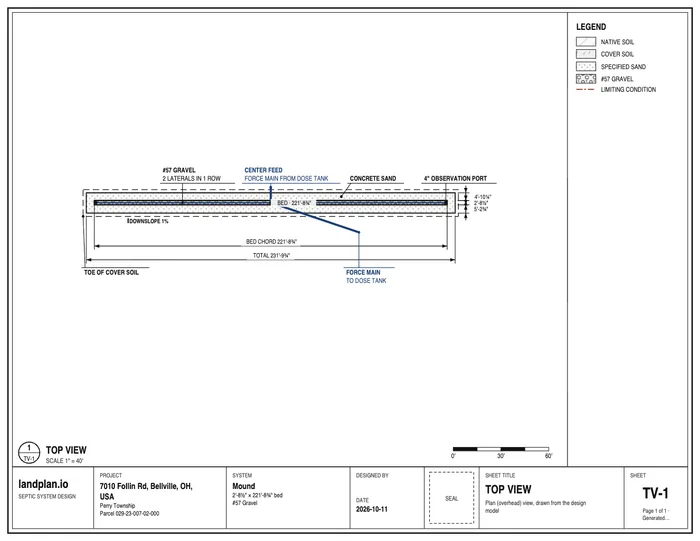
The absorption area seen from above, with its dimensions, where the force main feeds it, the observation ports and a legend.
Map Print
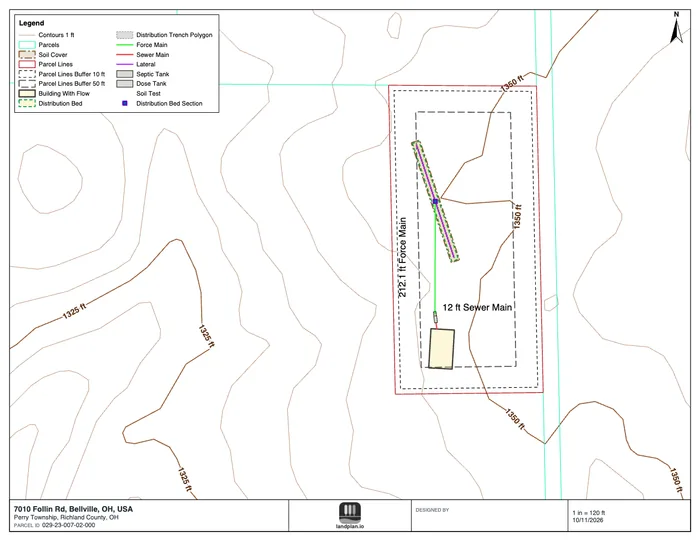
The site plan: the parcel, the setbacks, the house, the tanks, the pipes and the system, over the contours. It is the map's print page, as you set it up with Print on the map.
Dosing Detail
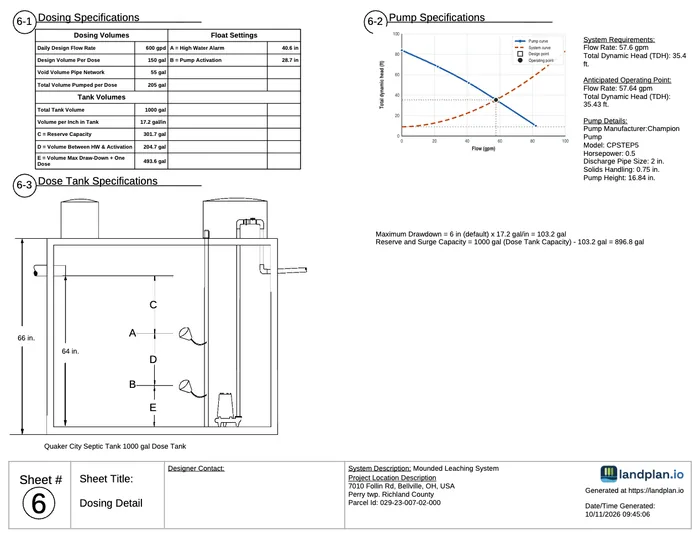
The dosing volumes and float settings, the pump's specifications and curve, and a drawing of the dose tank with the floats. Only pumped systems have this sheet. See Dose Tank and Floats.
Calculations
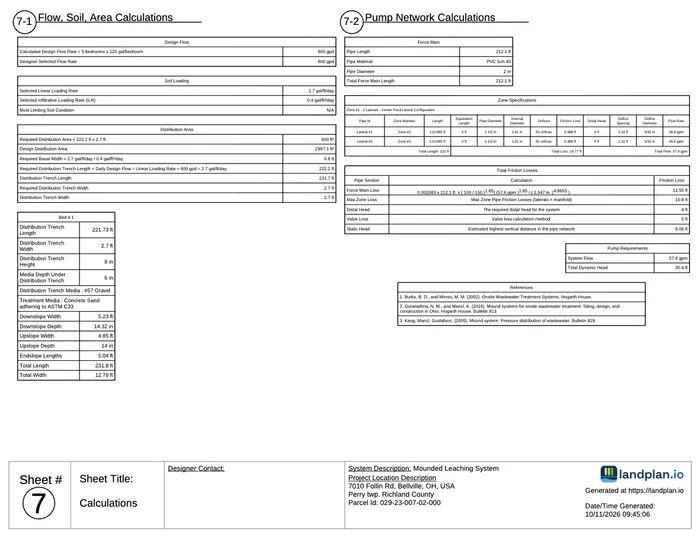
The flow, soil and area calculations, and for a pumped system the pump network: the force main, the zones, the friction losses, the pump requirements and the references.
More sheets
You can add these from Sheets from the design or the page list:
- System Detail – Enlarged.
- Site Topography.
- Full Parcel - Site Context. It is ticked by default in Texas.
- Files you attach, and product spec sheets.
The cost estimate is a separate PDF. See Cost Estimate.
Report versions
Each time you generate the PDF, the report is kept as a version. When you open Details again, or click Reports, the opening screen shows:
- Continue this report. Picks up the report where you left off, at the step you were on. It keeps the values you changed in Details.
- Start a new report. Starts again at step 1, Flow & Sizing, from what's on the map now. Use it after you change the design on the map.
- Generated versions. Every report you generated, by date. Click Open to see one.
Related guides
From the landplan.io blog: