
Soil test forms
Each soil test holds the test hole's data: where it is, who evaluated it, its horizons and its limiting conditions. The design reads the limiting condition and the loading rates from it.
There are two ways to fill it in:
- Your state's soil test form. A full-screen form laid out like the printed sheet, for states that have one, such as Ohio and North Carolina. It opens from the soil test list and the projects page.
- The Soil Test window. The form for every other state, with the fields of your state's configuration. It also opens when you place a soil test on the map, or select one.
You can also log a test hole step by step with the Soil Field Log (beta). All three save the same soil tests.
Which form opens
| You | What opens |
|---|---|
| Click Soil test in the Soil tools, then click the map | The Soil Test window, with the point's latitude and longitude. |
| Select a soil test on the map | The Soil Test window for that test. |
| Click Add a soil test in the soil test list | Your state's soil test form, or the Soil Test window. |
| Click Edit on a row of the soil test list | Your state's soil test form on that test, or the Soil Test window. |
| Click Open in Field Log (beta) on a row | The Soil Field Log on that test. |
The soil test form
The Soil Test Form fills the screen. It stays white in dark mode, like the paper sheet.
The test
The top of the form describes the test hole and the site:
| Field | What it is |
|---|---|
| Bore # | The test hole's name, for example Soil Test 1. |
| Landform, Position of Landform | Where the hole is in the landscape. |
| Percent Slope, Shape of Slope | The slope at the hole. The slope sets the linear loading rate. |
| Land Use / Vegetation | What the ground is used for now. |
| Method | Pit, Auger or Probe. |
| GPS Type | Decimals Degrees or Degrees/Minutes/Seconds, for the Latitude and Longitude below. The target button (Use Device GPS) fills them from your device. |
| Date Conducted | When the hole was evaluated. |
| Are you the Evaluator? | Untick it to type the Soil evaluator's name, as it should appear on the report. |
Horizons
The form has six horizon cards, or more when the test has more. Fill one per horizon, from the surface down.
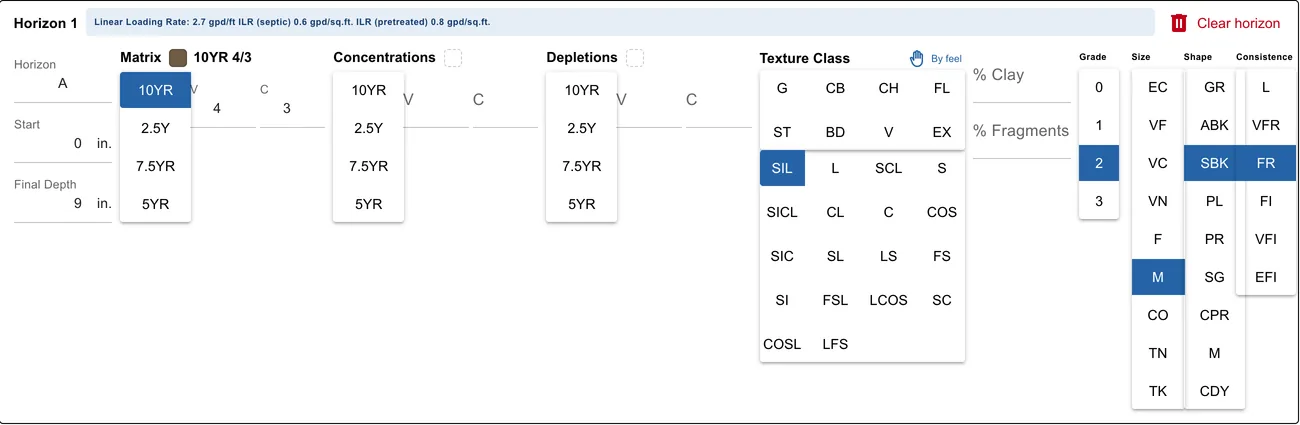
| Part | What you enter |
|---|---|
| Horizon | Its designation, for example A, Bt1 or Cd. |
| Start and Final Depth | In inches. The next horizon starts where this one ends. |
| Matrix, Concentrations, Depletions | The Munsell color: pick the hue (10YR, 2.5Y, 7.5YR, 5YR), then type the value (V) and the chroma (C). A swatch and the notation, for example 10YR 4/3, show next to the name. |
| Texture Class | The rock fragment modifier in the first rows, then the texture class. By feel finds the class from a few questions, From % from the percent sand, silt and clay. |
| % Clay, % Fragments | The clay and rock fragment content. |
| Grade, Size, Shape | The structure. |
| Consistence | The moist consistence. |
The buttons show the codes of the paper sheet. Hold the pointer over a code to see its name.
| Codes | Names |
|---|---|
| Texture | S sand, COS coarse sand, FS fine sand, LS loamy sand, LCOS loamy coarse sand, LFS loamy fine sand, SL sandy loam, COSL coarse sandy loam, FSL fine sandy loam, L loam, SIL silt loam, SI silt, SCL sandy clay loam, CL clay loam, SICL silty clay loam, SC sandy clay, SIC silty clay, C clay |
| Modifier | G gravelly, CB cobbly, CH channery, FL flaggy, ST stony, BD bouldery, V very, EX extremely |
| Grade | 0 structureless, 1 weak, 2 moderate, 3 strong |
| Size | VF very fine, F fine, M medium, CO coarse, VC very coarse, EC extremely coarse; for platy structure VN very thin, TN thin, TK thick |
| Shape | GR granular, SBK subangular blocky, ABK angular blocky, PL platy, PR prismatic, CPR columnar, SG single grain, M massive, CDY cloddy |
| Consistence | L loose, VFR very friable, FR friable, FI firm, VFI very firm, EFI extremely firm |
Once a horizon has its texture, grade and shape, its loading rates show next to its title. See Loading rates.
Clear horizon empties one card. If the depths leave a gap, overlap, or a bottom is missing, a warning above the horizons says where. You can still save.
Limiting conditions
The last card has a row for each limiting condition, in this order: perched seasonal water table, apparent water table, permeable material, bedrock and restrictive layer.
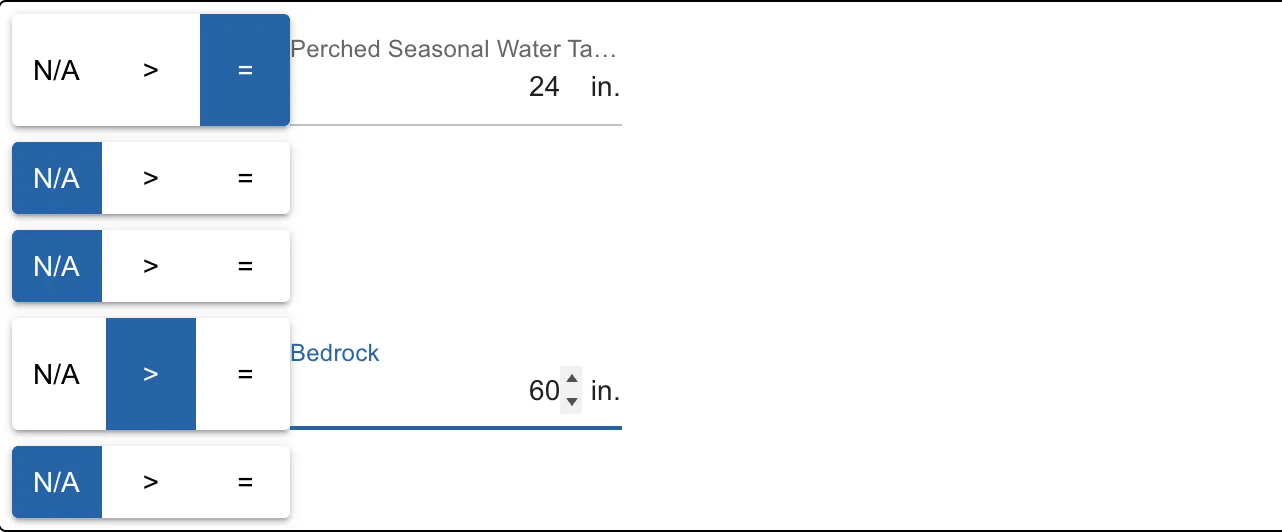
Choose N/A, > or = on each row, and type the depth for > and =. The field's name shows once a depth can be typed. See Limiting conditions.
Save, templates and NRCS data
The buttons at the top of the form:
| Button | What it does |
|---|---|
| Clear Entire Form | Empties the form. |
| Open Templates | Fills the form from one of your saved templates. |
| Save Template | Saves this form as a template, with a Name (required) and a Description (optional). Use it for sites you evaluate often. |
| Map NRCS Data | Reads the NRCS soil survey at the test's position. See below. |
| Save | Save & Clear saves, then empties the form for the next test, named with the next number and with the same evaluator. Save & Copy saves, then keeps the data as a new test with the next number. Save & Close saves and closes. |
| Close | Closes the form without saving. |
Map NRCS Data opens NRCS Soil Data Mapping: the soil mapped at the point and its map unit, the slope, the landform, the drainage class and the survey's horizons with their depth, texture, clay, fragments and structure. Tick what to include and click Add this Data to Form. Check it in the hole: the survey describes a typical soil, not this one.
On a phone or tablet, these buttons are in the menu at the top right of the form.
The Soil Test window
The Soil Test window is titled with the test hole (Soil test · Soil Test 1), with the project's address under it. Your state's soil test fields are grouped in sections. Most states have:
- Location: Latitude and Longitude (shown to 6 decimals, with the same point in degrees, minutes and seconds under each), and a Format switch between decimal degrees and degrees / minutes / seconds. A test on the map takes its point from the map.
- Test: the test hole number, the soil method, the date and the Soil evaluator (start typing to find one, or type a new name).
- Loading rates, with their units (gal/day/ft and gal/day/ft²). Under each rate: Default for this area while it is your state's or county's default, From soil type … when the soil type you picked filled it in, else Entered.
- Limiting conditions: a table with one row per limiting condition, where it was found (At, Deeper than or Not found), its depth in inches, the Separation needed below the system for it (your area's value, read from the saved test) and how far its depth is Short by. The one the design uses is marked Design uses this and explained under the table: Most limiting: Apparent at 27 in. It needs 36 in of separation and has 27 in, so the system must make up 9 in. A depth must be 0 or more; one below the logged horizons is flagged, and so is Deeper than 0, which counts as not found (enter the depth the hole went to). Beside the table, the soil column shows the horizons to scale in their colours, with a line for each condition (the most limiting in red). On the map, Edit horizons (or Add horizons) opens the test's soil profile.
- Site description: slope (%), land use, landform, position and slope shape.
A test made by quick create holds your area's quick-start values (soil method Assumed (quick start)). The window says so at the top: Quick-start values. Sizes are estimates until you enter the field test. Enter the field test sets a field soil method and takes you to the Test section; then enter the limiting conditions you found.
On the map, the site chip 1 soil test · check (under the site-at-a-glance button) opens this window too.
The fields and their defaults come from your state's or county's configuration. On a phone the sections are one column and the buttons stay at the bottom.
At the bottom:
| Button | What it does |
|---|---|
| Delete soil test | Deletes a saved soil test, after you confirm. |
| Add percolation data | Opens the percolation window: holes, timed readings and the rate. Reads Edit percolation data once there is some. See Percolation data. |
| Save soil test | Checks the fields and saves the test. |
The horizons of a test are edited from the soil test list: see Soil profiles.
Limiting conditions and None observed
A septic system needs enough unsaturated, suitable soil under it. The limiting conditions are what cut that depth short:
| Condition | What it is |
|---|---|
| Perched seasonal water table | Saturation above a slowly permeable layer for part of the year, found from gray depletions. |
| Apparent water table | Free water standing in the open hole. |
| Permeable material | Very coarse sand or gravel that passes effluent too fast to treat it. |
| Bedrock | Hard or weathered rock. |
| Restrictive layer | A dense or hard layer, such as a fragipan or dense till. |
Each one has a qualifier:
| Qualifier | Means |
|---|---|
| = | Found at this depth. |
| > | Not found above this depth: the hole went that deep without finding it. |
| N/A | Not observed. The depth is left empty and isn't read. |
When every condition is N/A, the test has no limiting condition. The calculator then says No limiting condition was observed in the soil test, the report's calculations sheet reads None observed, and the cross section uses the design's assumed depth.
Your state or county sets the separation the system needs above each condition. The most limiting one is the one that leaves the least separation: the separation it needs less its depth is the largest (the shallower one on a tie). It is not always the shallowest: a perched water table at 12 in that needs 12 in is less limiting than an apparent water table at 27 in that needs 36 in. The window, the design, the cross section and the mound sizing all use this one.
Suggested limiting conditions
Under the limiting conditions, the form suggests some from the horizons you logged, for the conditions still empty or N/A: for example a seasonal water table at the first horizon below the surface with gray depletions, or bedrock at an R or Cr horizon. Each one says why: Suggested: bedrock at 30 in — ….
Click Apply to use one. Nothing changes until you do. Check each suggestion against the hole.
When you entered a seasonal water table deeper than the gray (chroma 2 or less) depletions you logged, the form asks you to check it: Check: perched seasonal water table entered at 42 in, but the horizons suggest 30 in — …. Click Use 30 in to change it; otherwise your value stays.
Loading rates
The loading rates say how much effluent the soil can take:
- Linear Loading Rate (gpd/ft): per foot along the contour.
- ILR (septic) and ILR (pretreated) (gpd/sq.ft.): per square foot of trench or bed bottom, for septic tank effluent and for pretreated effluent.
They come from your state's loading rate table, from the horizon's texture, grade and shape. The linear loading rate also depends on the slope and the horizon's depth. The soil test list shows each test's rates in its Loading Rates column.
The design's soil analysis picks the rate it uses by your state's rules. You can see and change it in Details.
Percolation data
If you ran a percolation test, click Add percolation data in the Soil Test window. Each hole has its own tab (Hole P1 · 40 min/in); Add a hole adds the next one with the same depth and diameter.
- For each hole, type its Depth and Diameter (in the Units chosen on the right, inches by default) and tick Presoaked with the hours if you presoaked it.
- Type each timed reading in the empty row: the Interval in minutes and the Water level at its start and end. The row shows the Drop and the Rate (minutes per inch); the next reading takes the same interval.
- A hole is steady when its last two readings agree within 10%: those rows are highlighted and the hole's rate is its last reading's. Until then the sheet says to keep reading.
- On the right, the Result is the average of the holes' rates. Where your area's table maps a percolation rate to a loading rate, the rate it gives is shown too.
- Click Use for this soil test to give the test this percolation rate (and that loading rate), or Save readings to keep only the readings. Then click Save soil test.
Without timed readings, type the rate from your field sheet in Percolation rate and click Use for this soil test. Readings entered before this window changed are kept as they are.
In the Soil Field Log, open Percolation under the limiting conditions. See Check the limiting conditions and save.
Texture by feel
By feel, next to Texture Class, finds the texture from what the soil does in your hand. It asks one question at a time, starting with Squeeze a handful of moist soil. Does it hold together as a ball? Your answers give the class, which goes into the horizon.
See Texture for how it works.
Texture from sand, silt and clay
From %, next to By feel, finds the USDA texture class from the percent sand, silt and clay of a lab test or your estimate. Type any two and the third is worked out; three that don't quite add up to 100 are scaled to 100. Click Use to put the class into the horizon. An empty % Clay takes the clay you typed. The North Carolina form has the same button under each horizon's texture, and the soil profile's horizon editor has From % sand, silt, clay.
North Carolina
North Carolina projects use the North Carolina Soil/Site Evaluation form, with every soil test of the project on one page. Its header has the Owner, Location of Site, Property Recorded, Property Size, Proposed Facility and Proposed Design Flow, and each soil test has its LTAR and Slope Correction under its horizons. It saves, clears, uses templates and maps NRCS data like the form above.
Related guides
From the landplan.io blog: